
ES 06-18 / 24. May 2018

It's been a while since my last daily market digest due to educational work on a class course about understanding order flow, order book and trading it based on Bookmap™.
More confidence with CVP
Today's daily digest is about how to better understand what's happening at certain price levels.
A numerical order book displays the CVP columns like this:

Bookmap™ is very flexible in defining and rearranging the order book. One maybe most overseen feature is the Chart Range Accumulated Volume Profile (CVP). CVP displays accumulated BID and ASK data.

The amount of data in a numerical order book can be disturbing and not neccessary helpful. But breaking down the volume to a certain level and watching it gives a big advantage over common technical trading analysis.
Have a look here to understand what I mean:
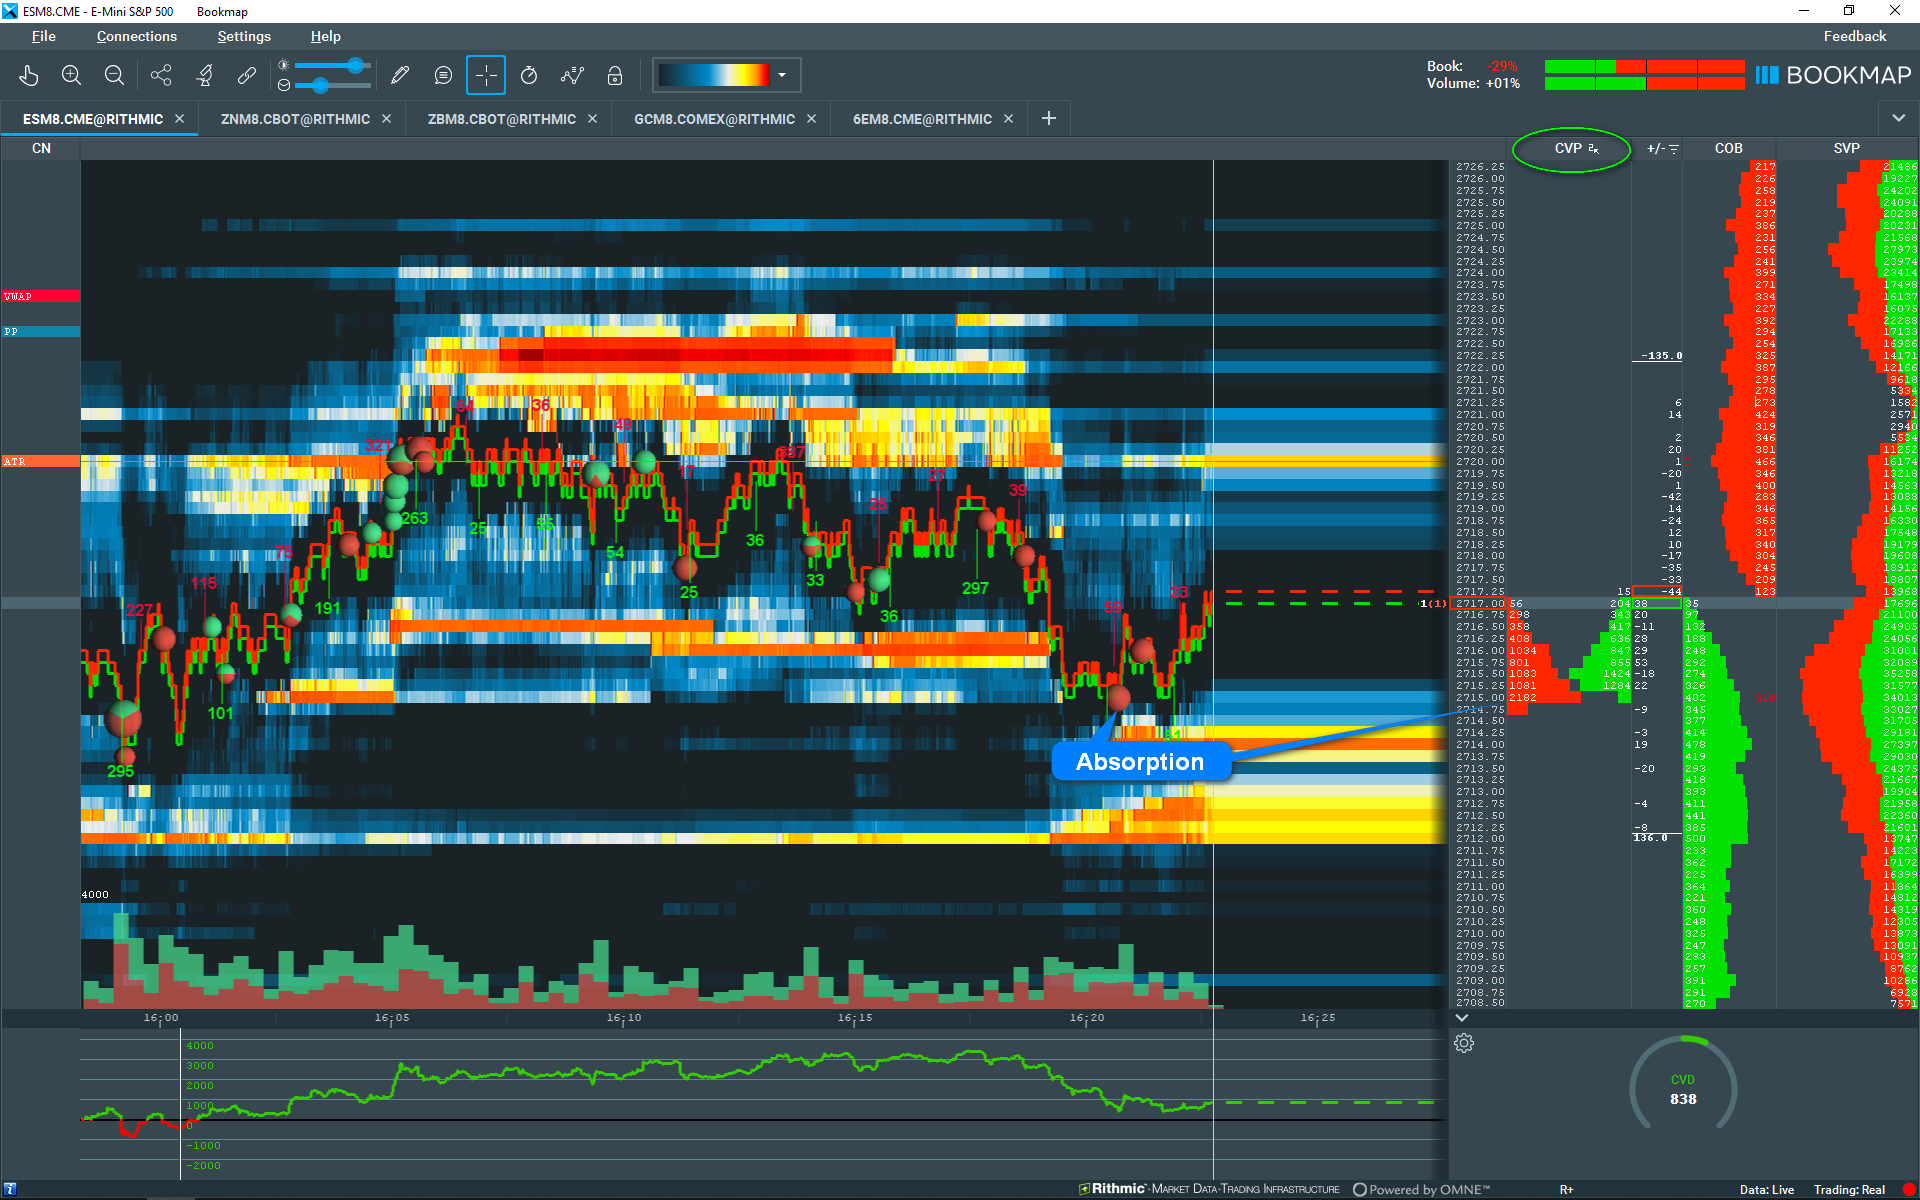

On both screenshots you can see that the volume (CVP) at these levels is stripped down. The reduction of volume data gives us a clue who actually dominates which side of the Limit Order Book (LOB).
Screenshot labeled "Absorption confirmation" shows that 2182 contracts were traded on the bid at 2715.00. No selling after that price levels was indicated. 2182 contracts didn't sweep the price. That's called absorption. Immediately after that 1284 contracts were traded on the offer. Price jumped up and retraced.
Second Screenshot labeled "Reversal confirmation" is impressive as well. At 2715.25 there were 1588 contracts traded on the bid and 1785 contracts traded on the offer. Tick lower at 2715.00 more selling hit the bid. 2026 contracts were traded on the bid at 2715.00 and only 102 on the offer.
That was selling pressure. Seeing the red dots and seeing how much volume was traded at that level gives an objective reason to take a short with a reasonable R/R ratio. See also MAE.
How to setup
If you are a Bookmap™ user and trader follow this sequence to setup your own Chart Range Accumulated Volume Profile:
- Insert a column
- Right click mouse and select Volume
- Select Configure Column
- Check "Split Display" and close
- Right Click into column
- Select Reset
- Check "Reset on Double Click"
- Column Label "CVP" comes with a small sign that represents the double click
You're done. Everytime when price approaches a liquidity level you can easily double click into the CVP column, reset the volume and see in real time which aggressor dominates this specific level of the LOB at that moment.
My tweet added here:
@Bookmap_Pro Tip:
— ttwatrader (@ttwatrader) May 24, 2018
Bid and Ask Volume Profile column can be resetted fastly by double click into the column itself. Right-click mouse - select Reset and then check "Reset at double click".
Traded bid and ask numbers allows to track absorption and exhaustion!@pebe187 #orderbook pic.twitter.com/MwHezckK2L
Does it work for you? Leave a comment.


Comments