

Spot Reversals with Large Volume Clusters

Volume clusters are the key to early detection of market reversals. Not all reversals are identified by large volume clusters, but a high percentage of them are.
The interesting thing about large volume clusters is that they do NOT represent an increase in trading activity.
Suppose your market trades at 1000 contracts per minute. 5 minutes pass and 5,000 contracts are traded, but no large volume clusters. Then we see a cluster of large volume cluster in the next 5 minutes - but we have only traded 5,000 contracts. The volume was the same, but this time we have large volume clusters. How is that possible?
Large Volume Clusters Explained
A volume cluster occurs when an unusual large amount of volume is traded at one price. For example, on EURUSD 6E Futures, we may see on average 20-30 contracts trade at each price before the market moves to the next price. Then we see a price where 200 contracts trade at a price. The reason for that is that trading is continuing but price is no longer moving. The market is no longer responding or reacting to buying or selling. Sellers are absorbing aggressor buyers.
The reason price doesn't change is because there is a "fight" between buyers and sellers on that price level.
For example see screenshots above. In a move up, buying might continue but traders with sell limit orders will add more sell limit orders as buyers trade at that price. This is called "stacking" to the offer. These sell limit orders "absorb" the buying and prevent any price movement upside. This process of adding more contracts is often done with an "iceberg order", where the order automatically refreshes after a certain amount has traded. Iceberg orders are a way of "secretly" hiding how much you want to sell or buy at a limit price. The reverse happens in a move down.
What is this move telling us?
This move is definively telling us:
- That the buyers are in control
- That the offers are getting out of the way
We know that because:
- The speed or acceleration of the price move
- There is no exceptional or large volume along this move
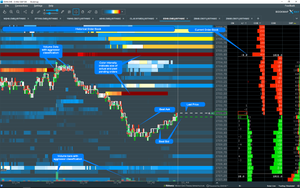
Top of the High
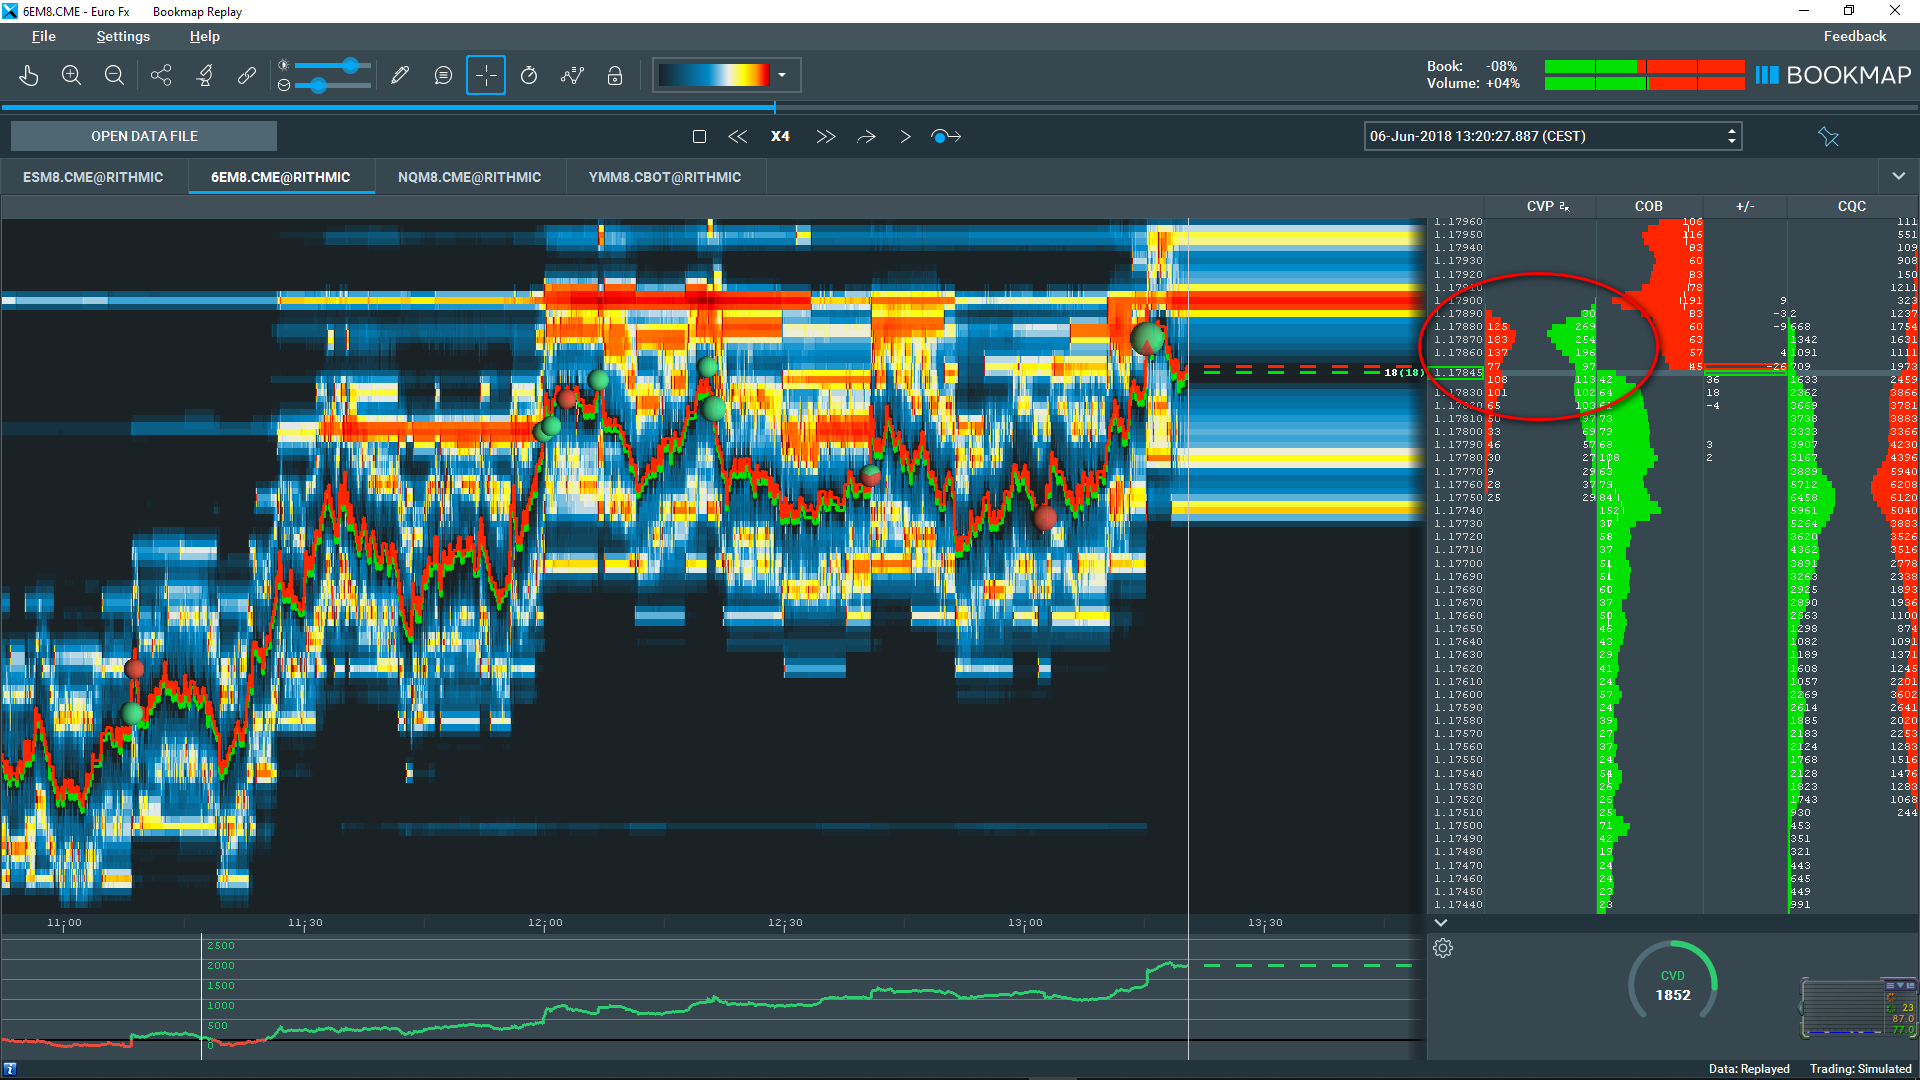
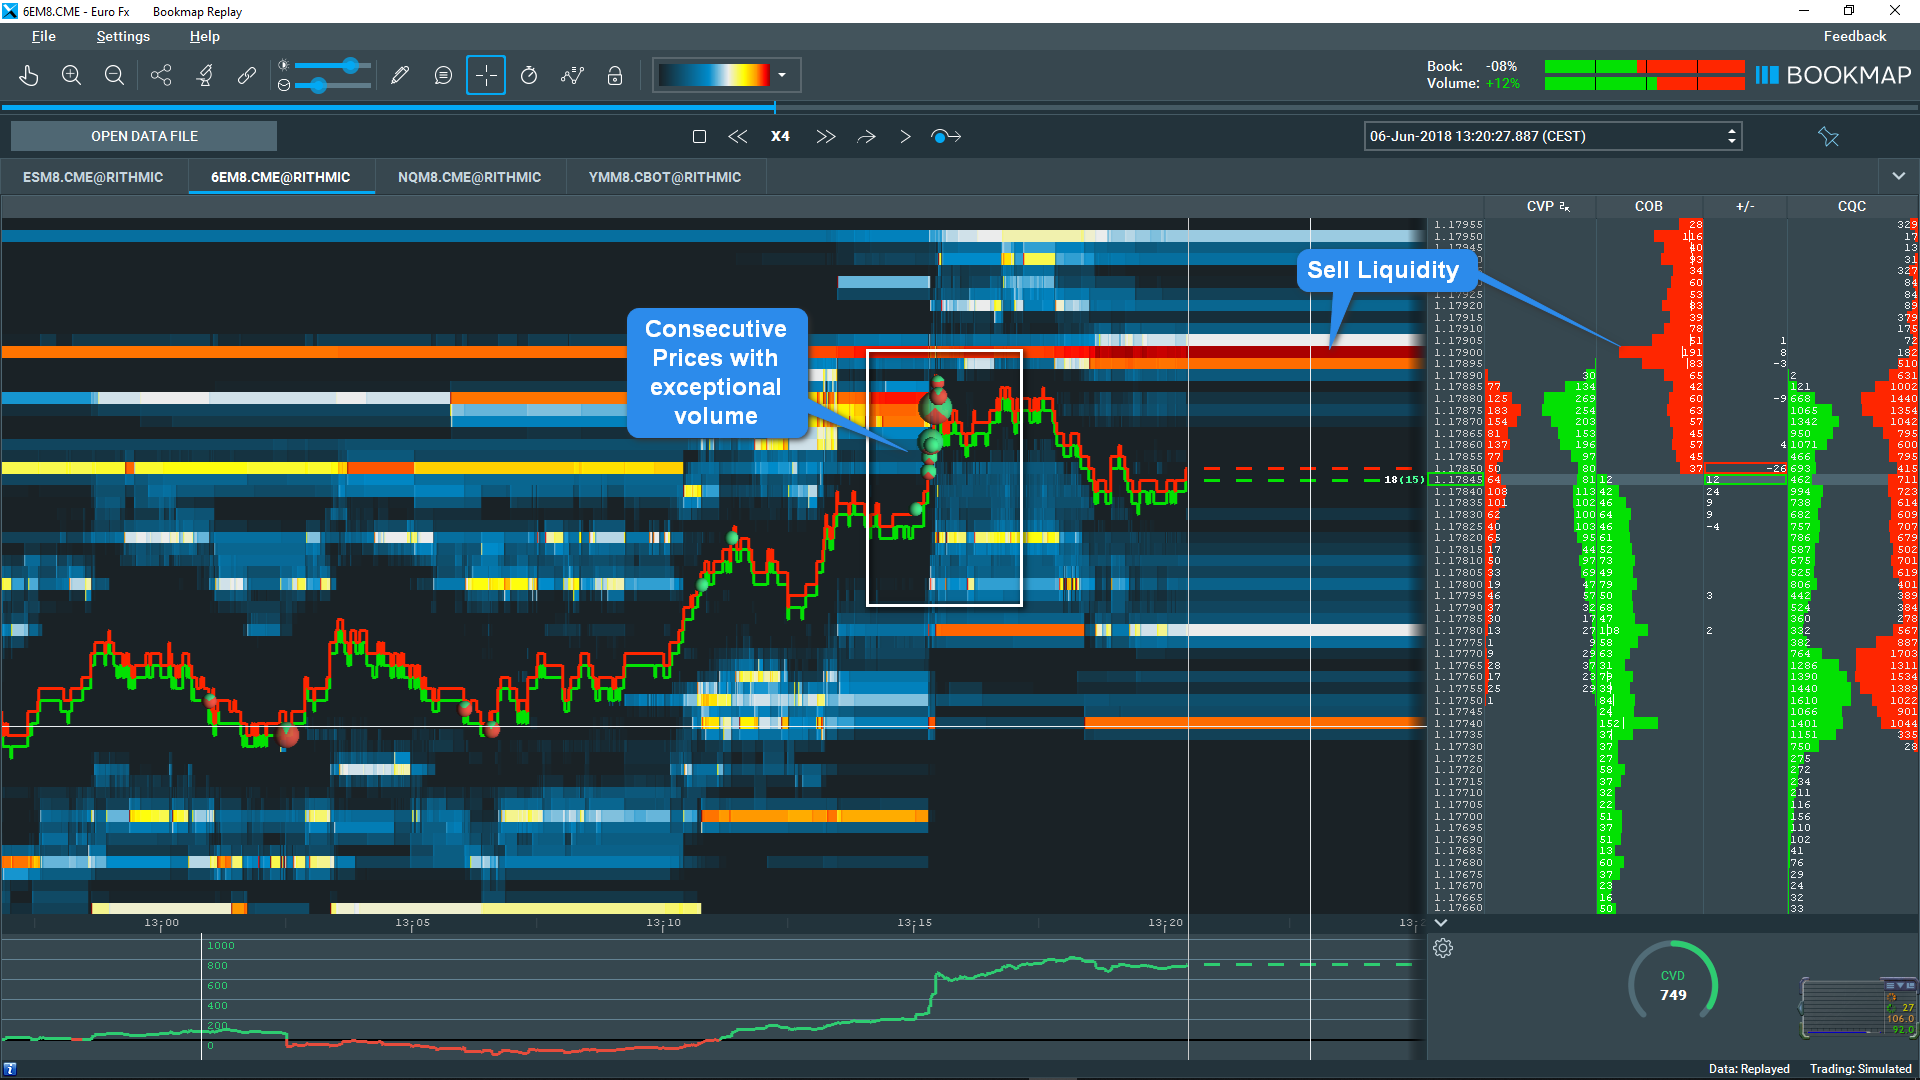
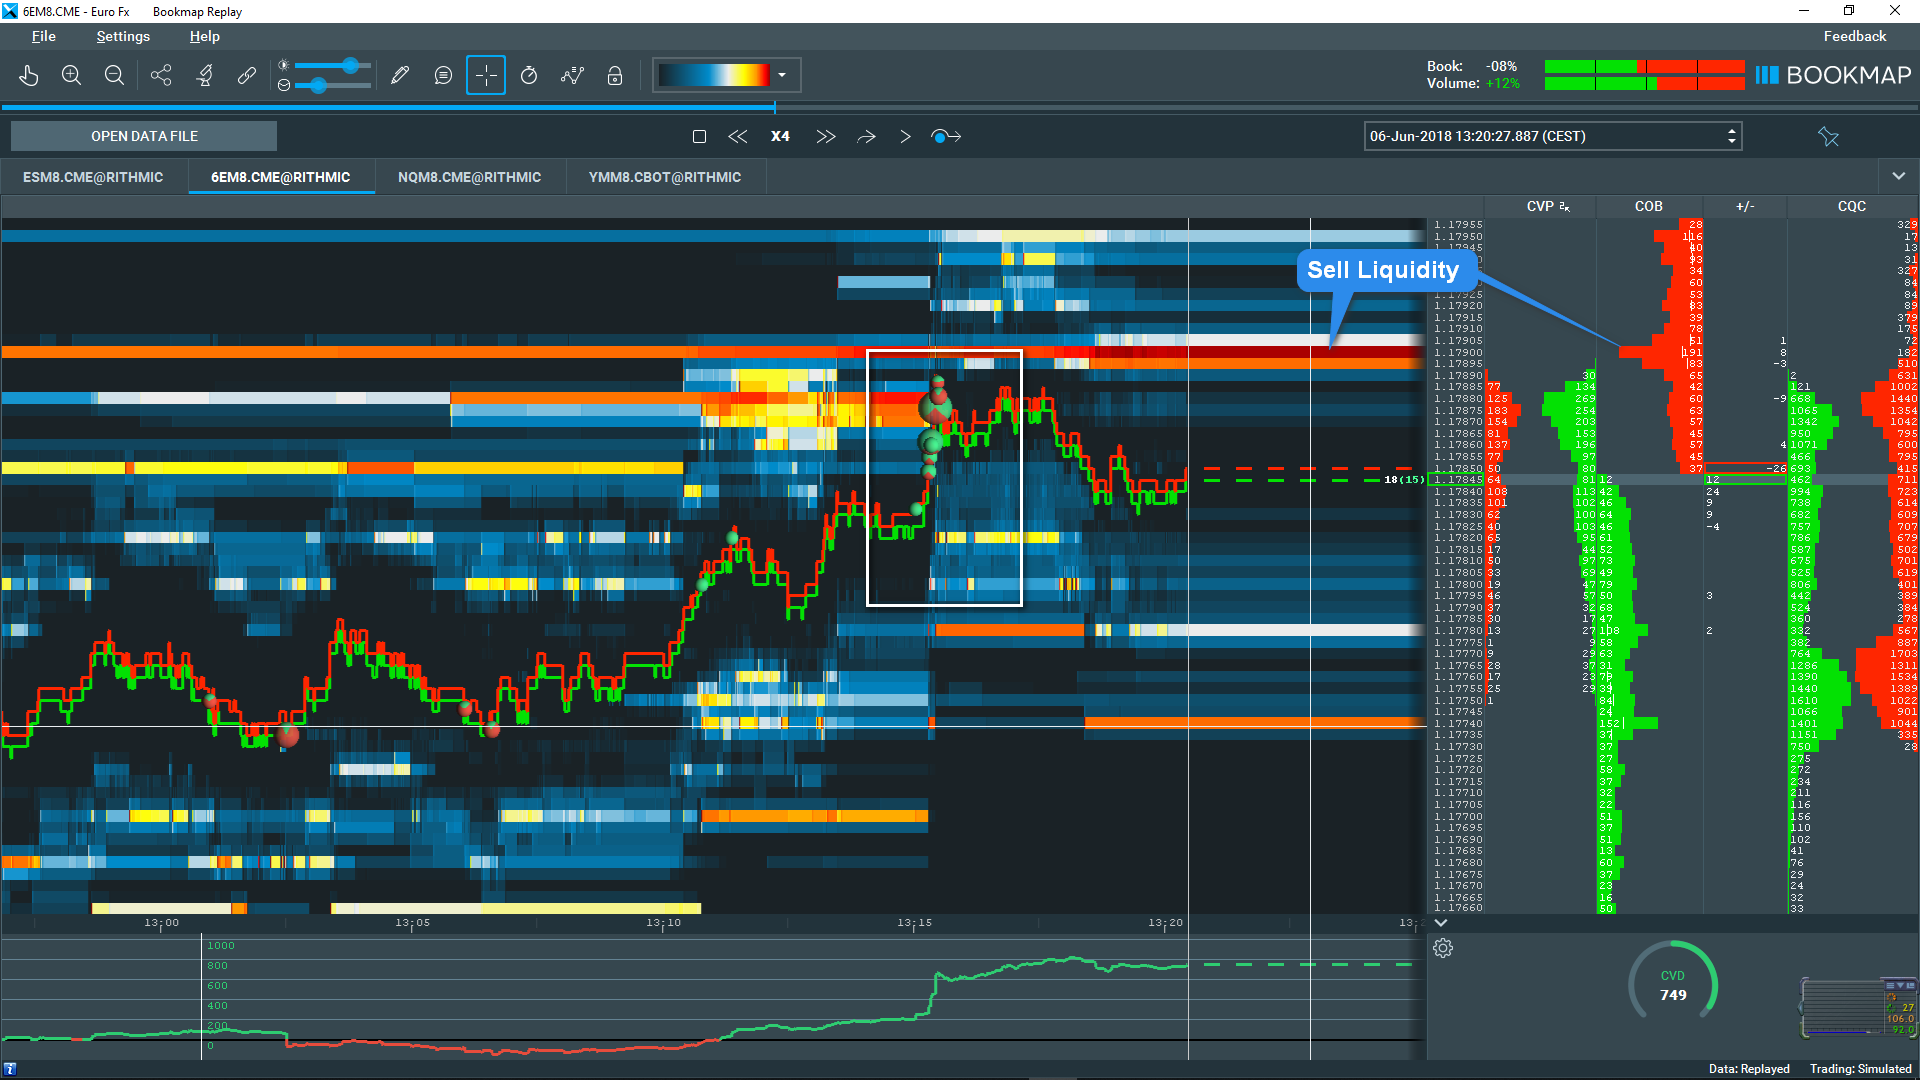
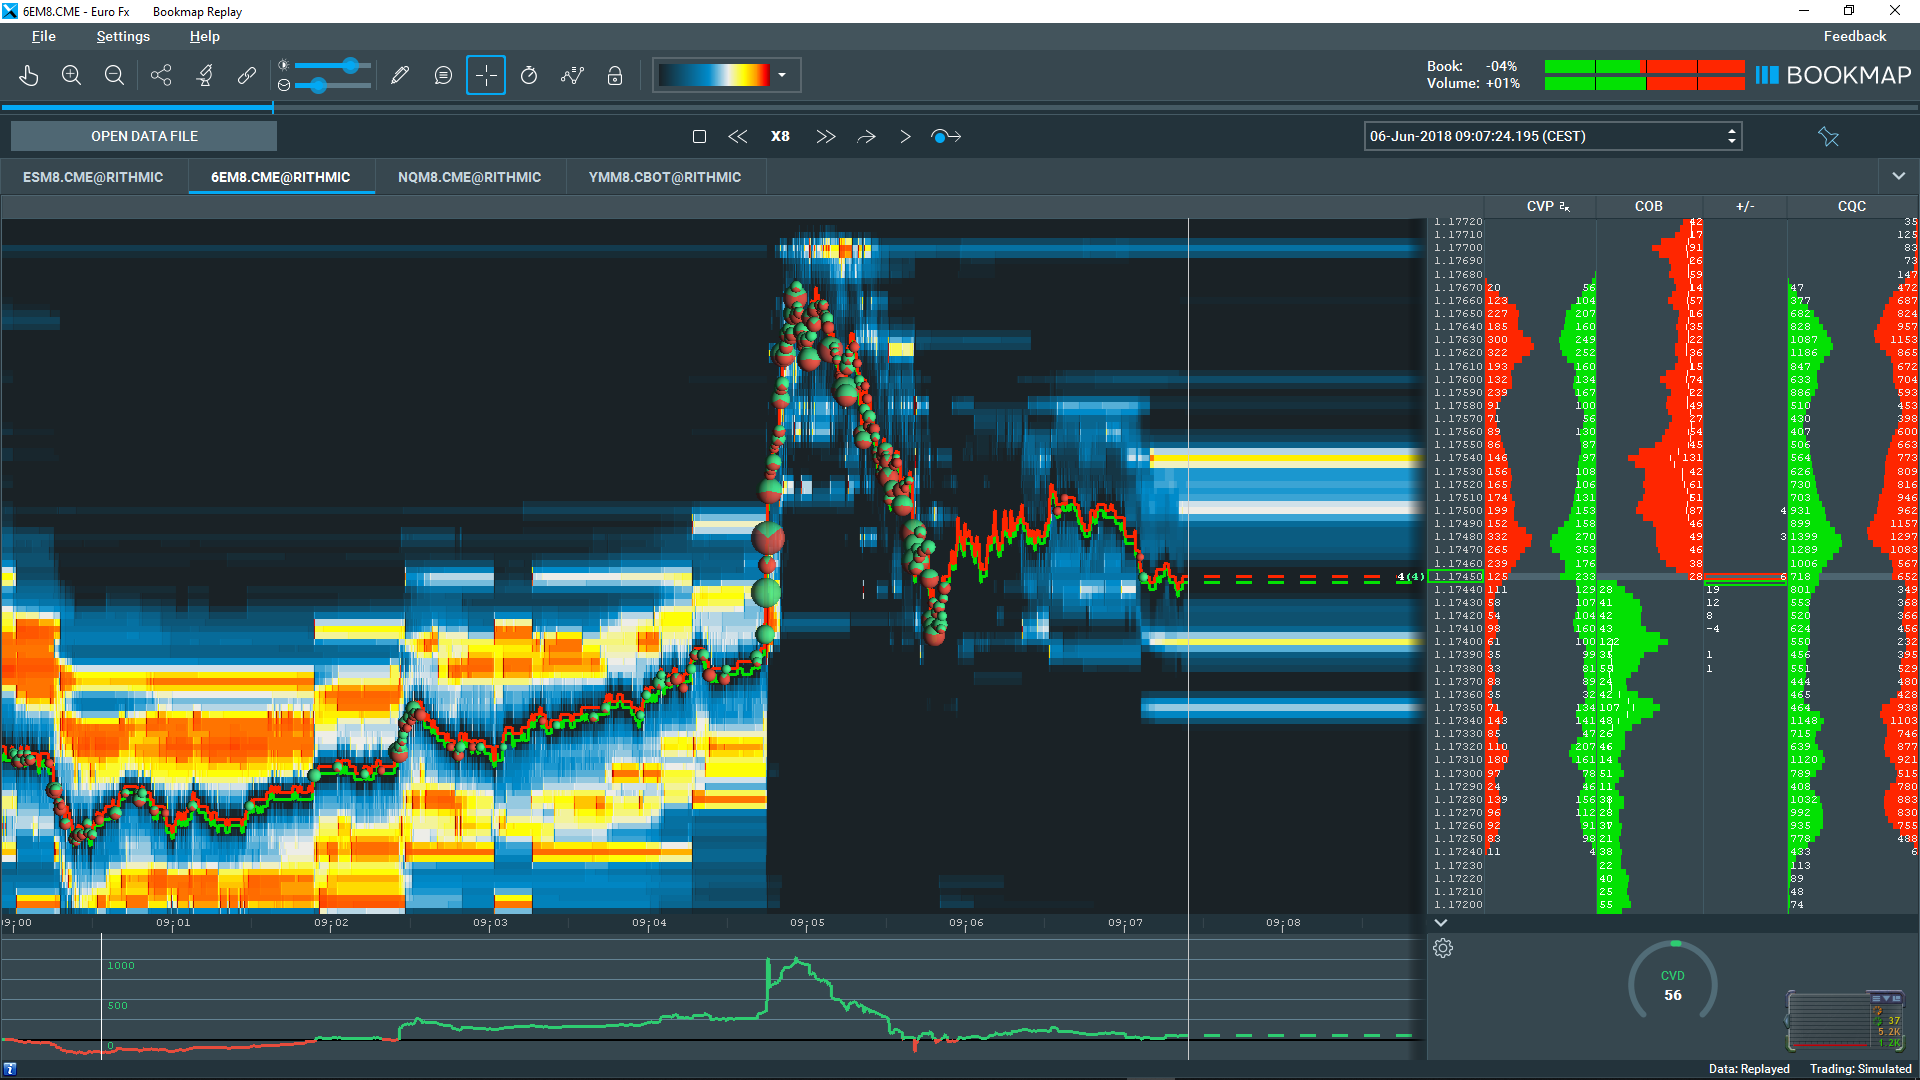
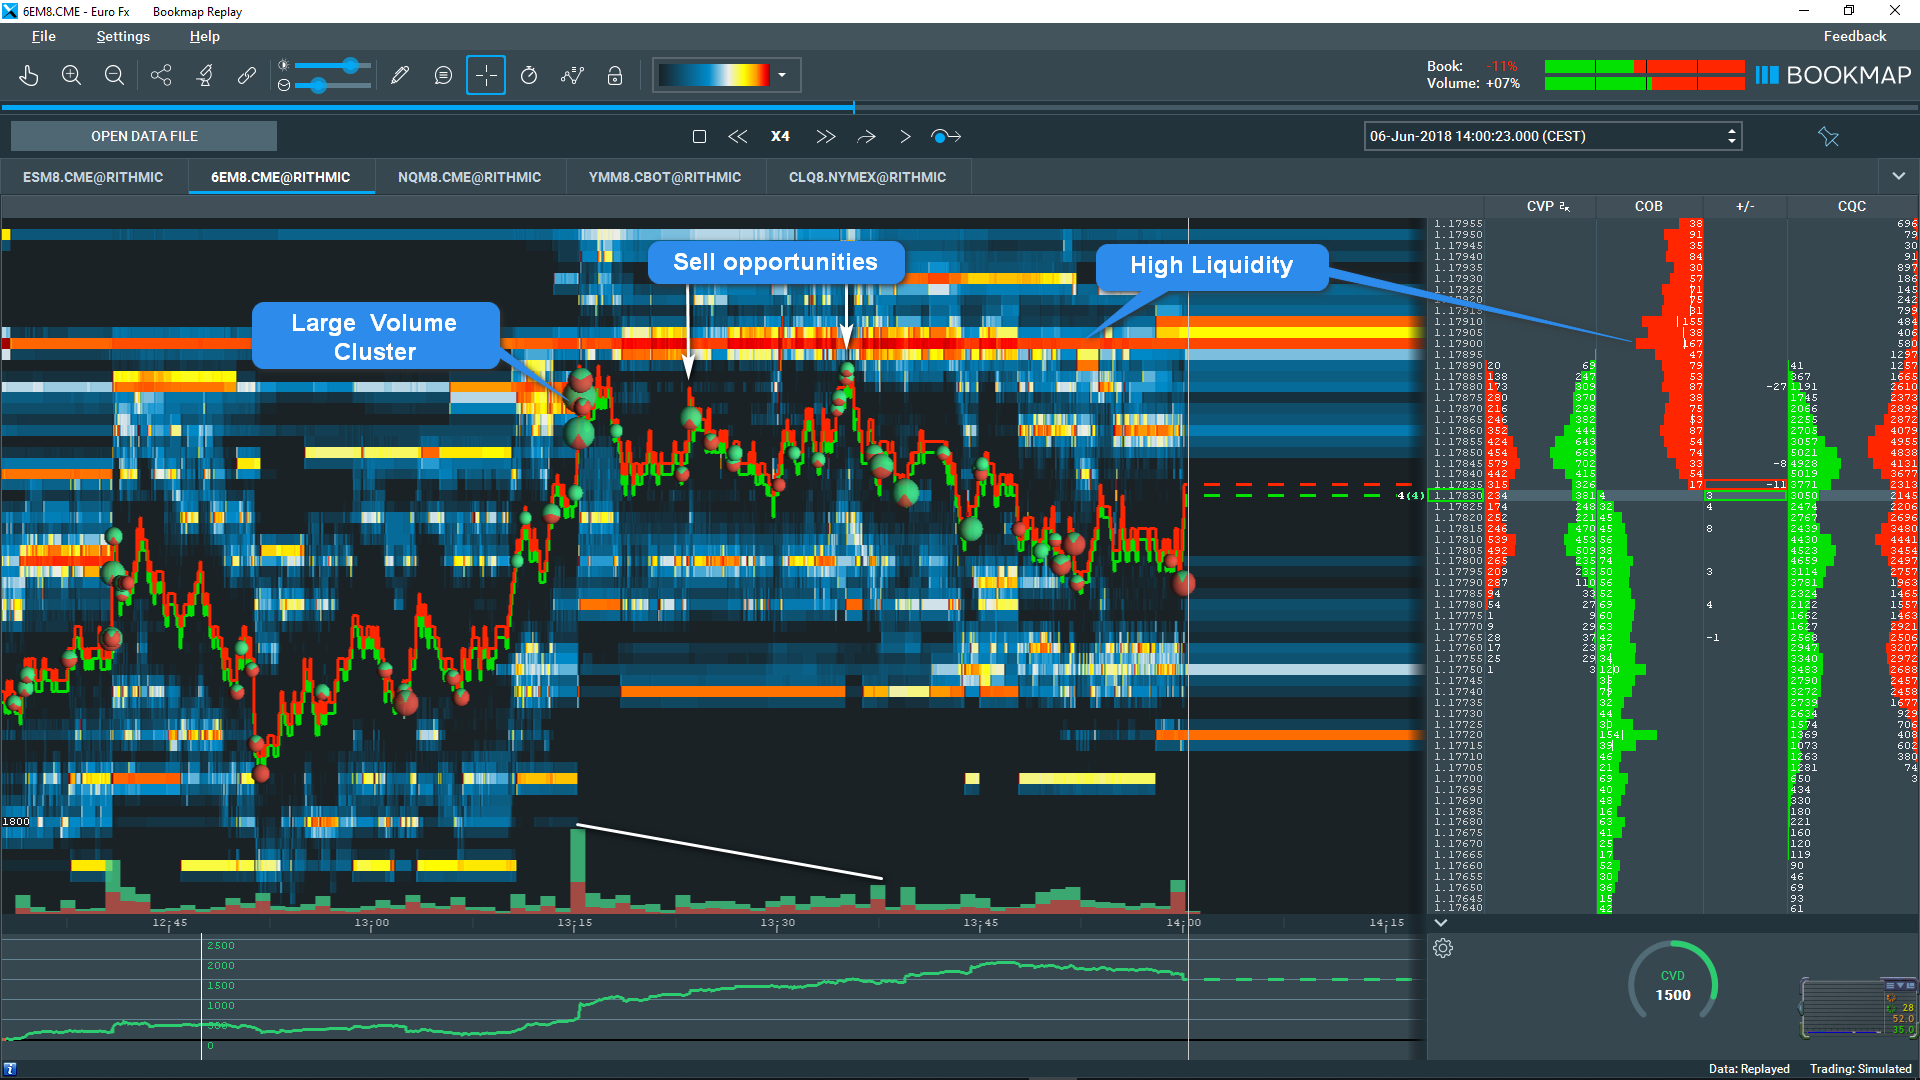
Let us zoom in the 6E future at ~ 1.17880 (6E - 06th June 2018) as you can see in the upper screenshots. We see that there is big sell side liquidity. We can see a number of consecutive prices with exceptional volume. What we can conclude from this is that traders with sell limit orders stayed firm as the buyers carried on buying. We also know that in this area with high sell liquiditiy buyers are affected to get stuck here.
We can measure the activities in these areas with the "Chart Ranged Accumulated Volume Profile" or CVP in Bookmap™ to see excatly how many contracts are traded.
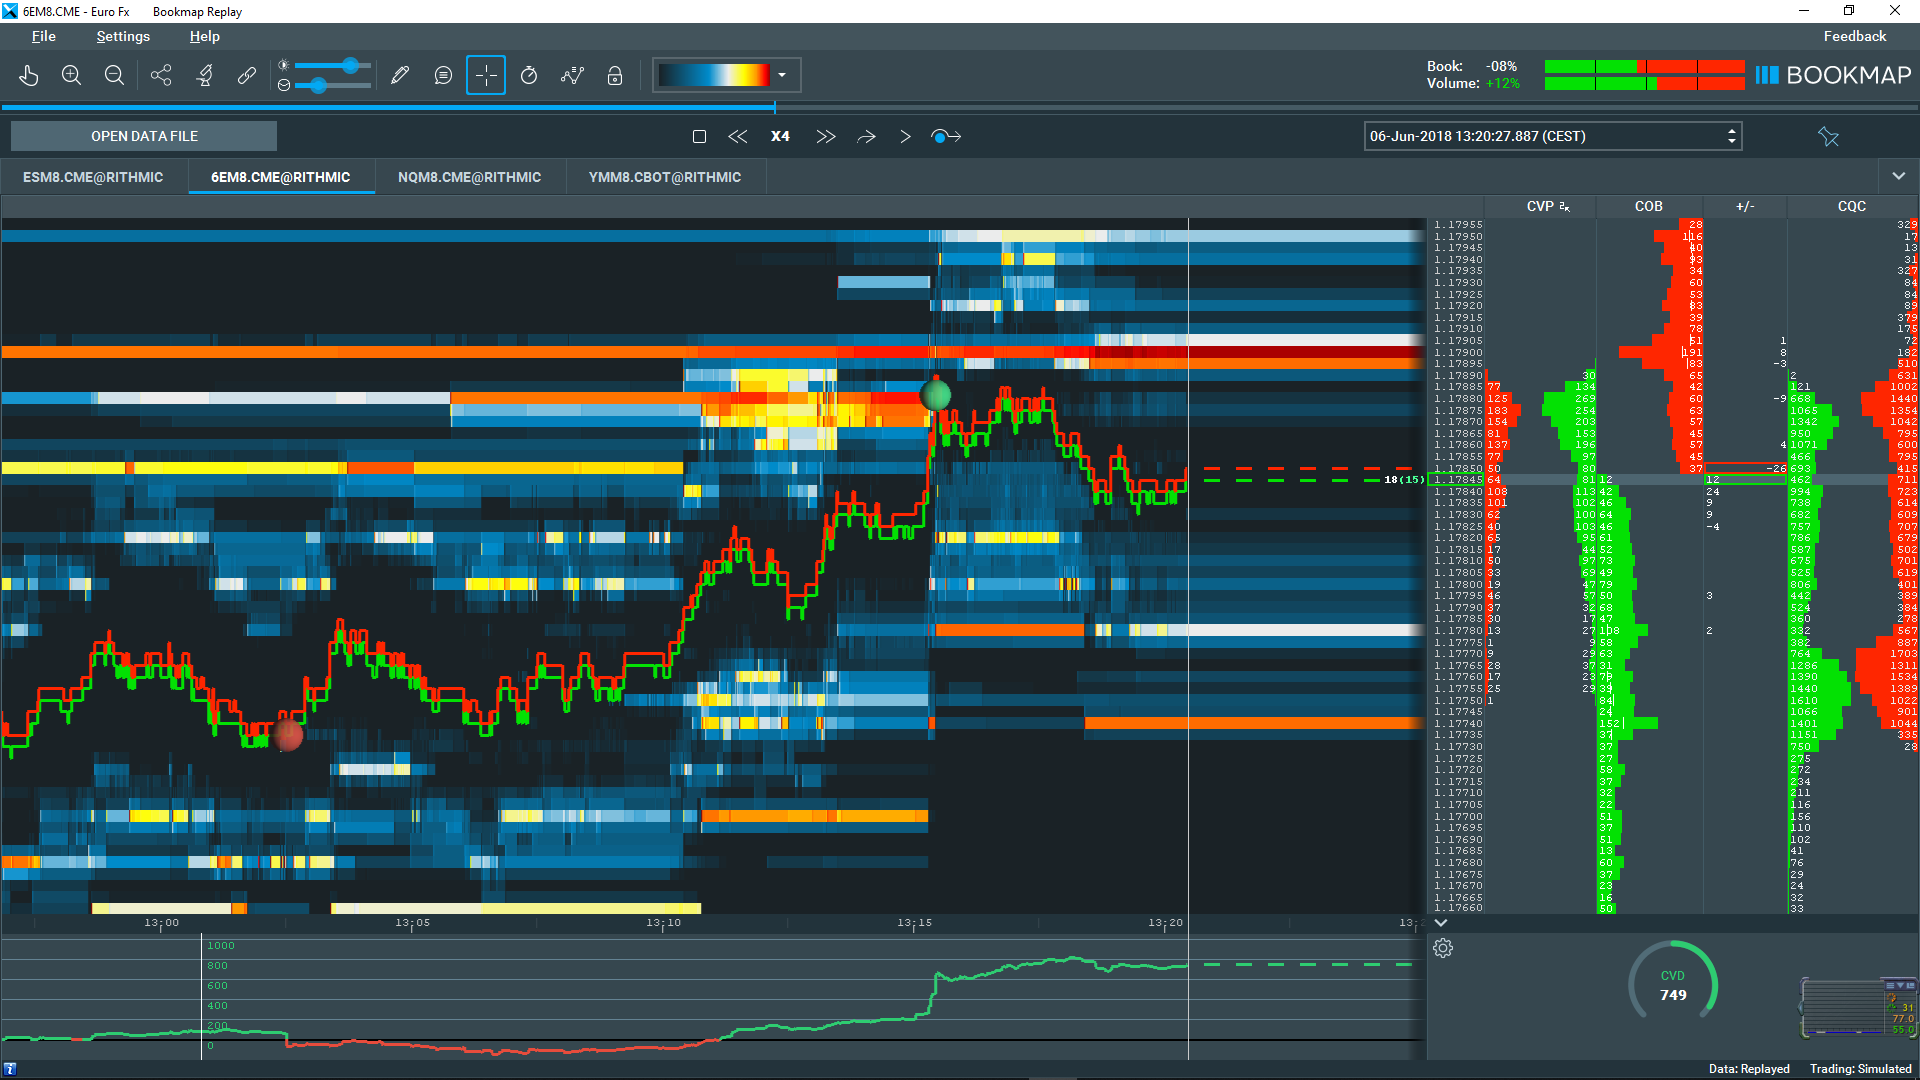
That indicates the end of the move. As the price reverses the buyers are going to get stopped out and that's what's helping us to move to the downside. Sellers won that battle.
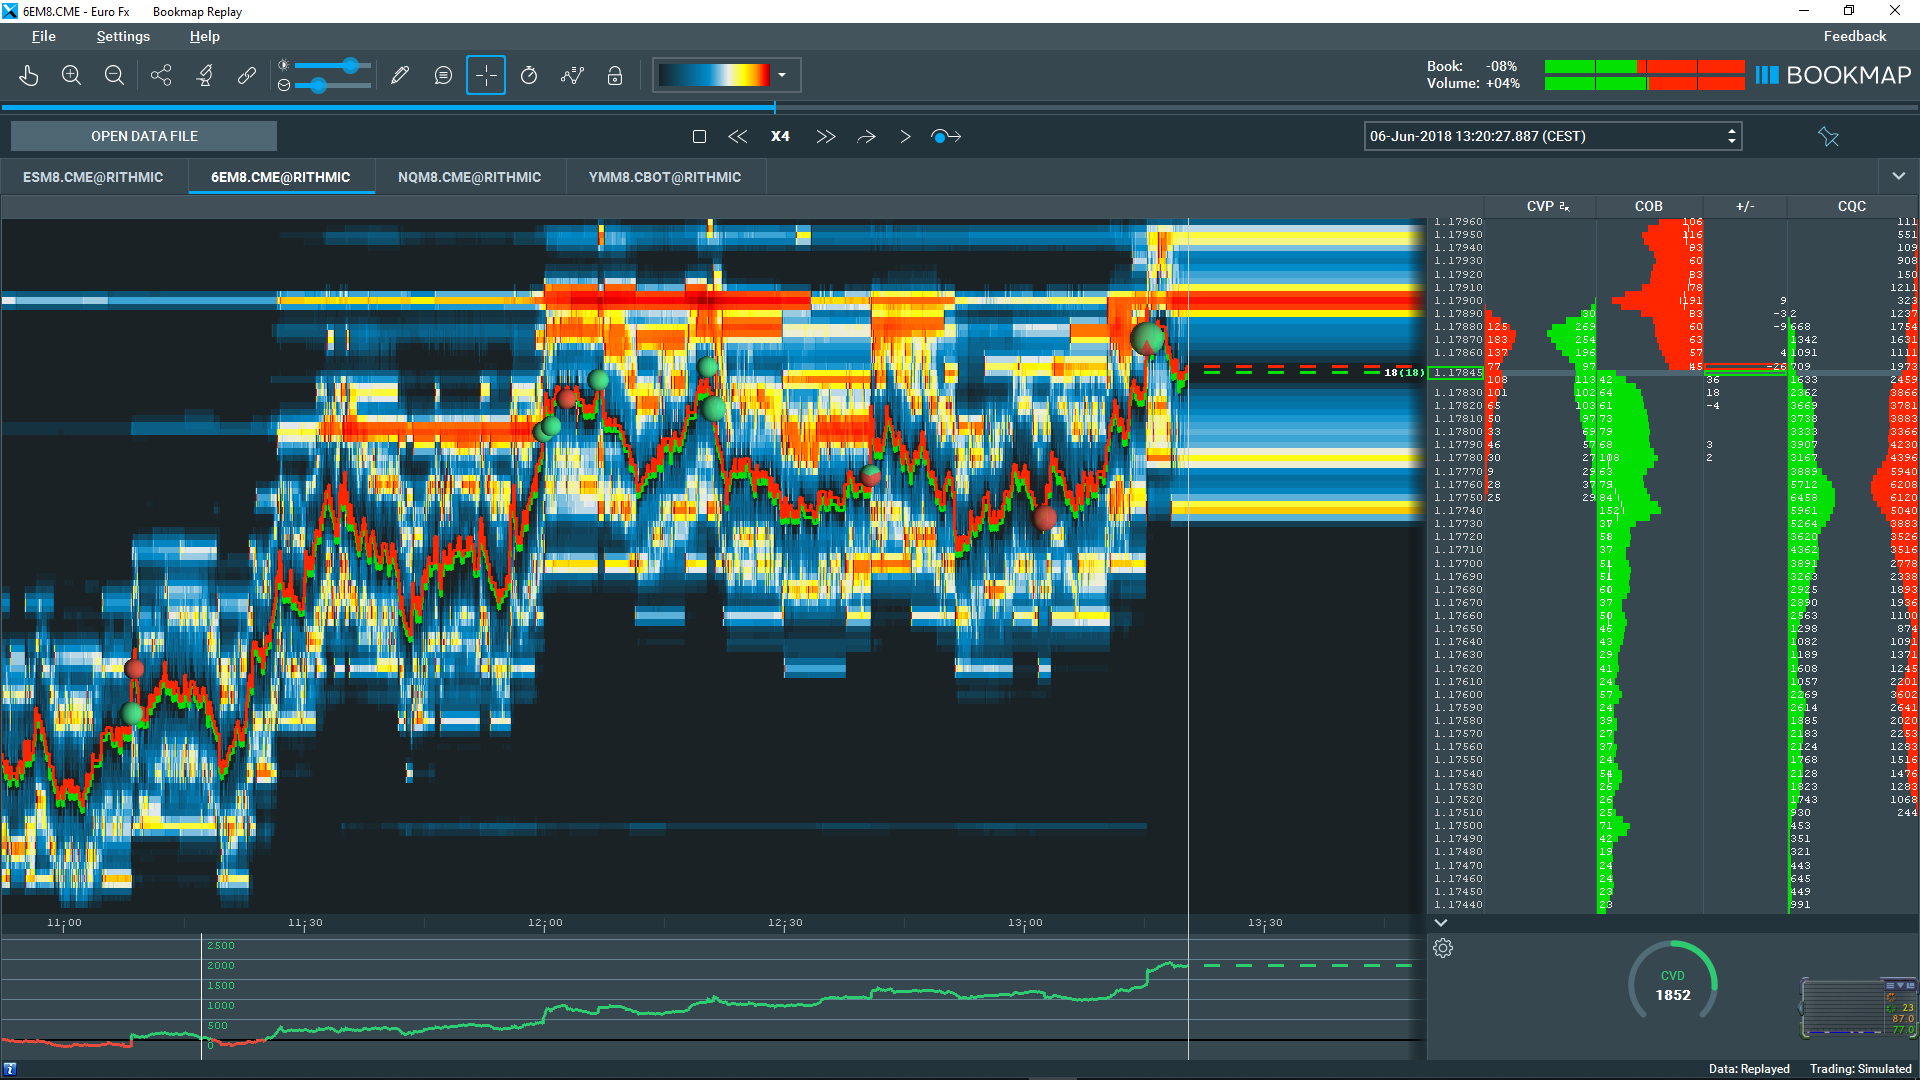
Examples
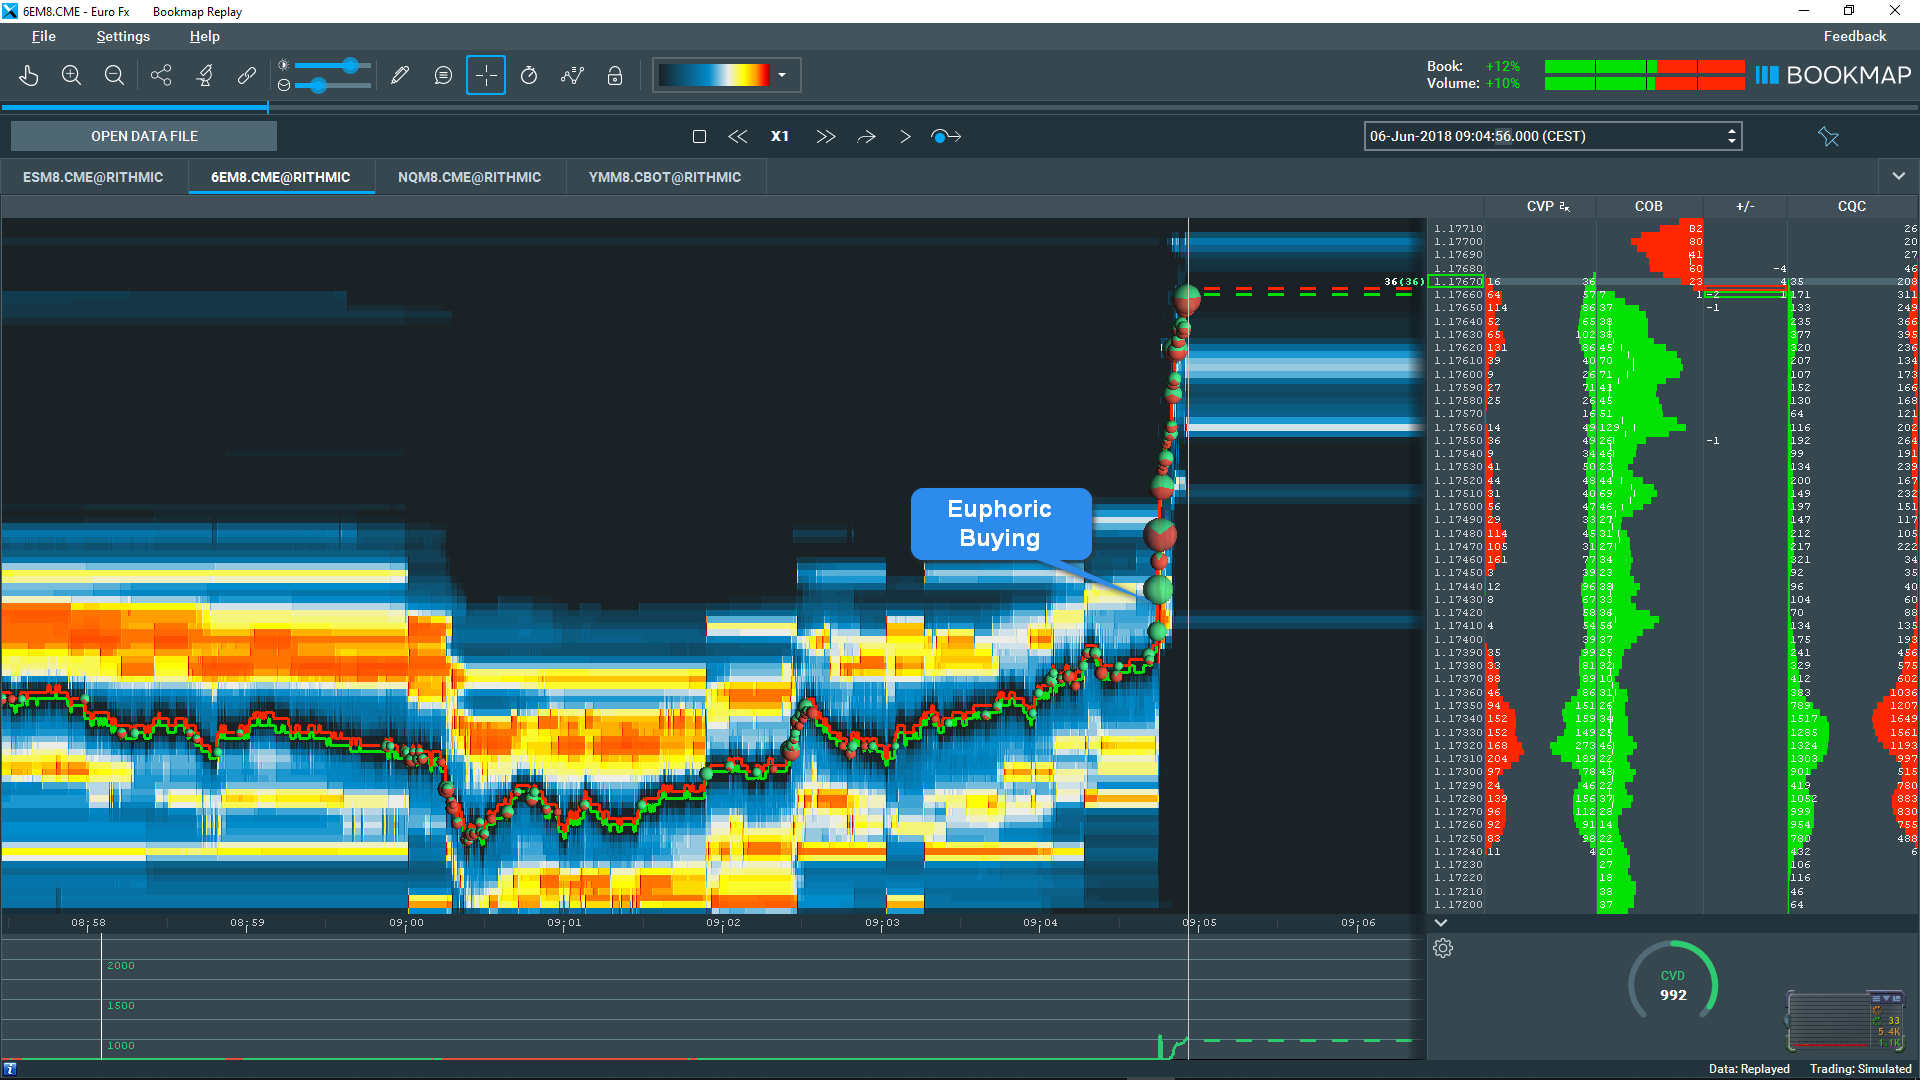
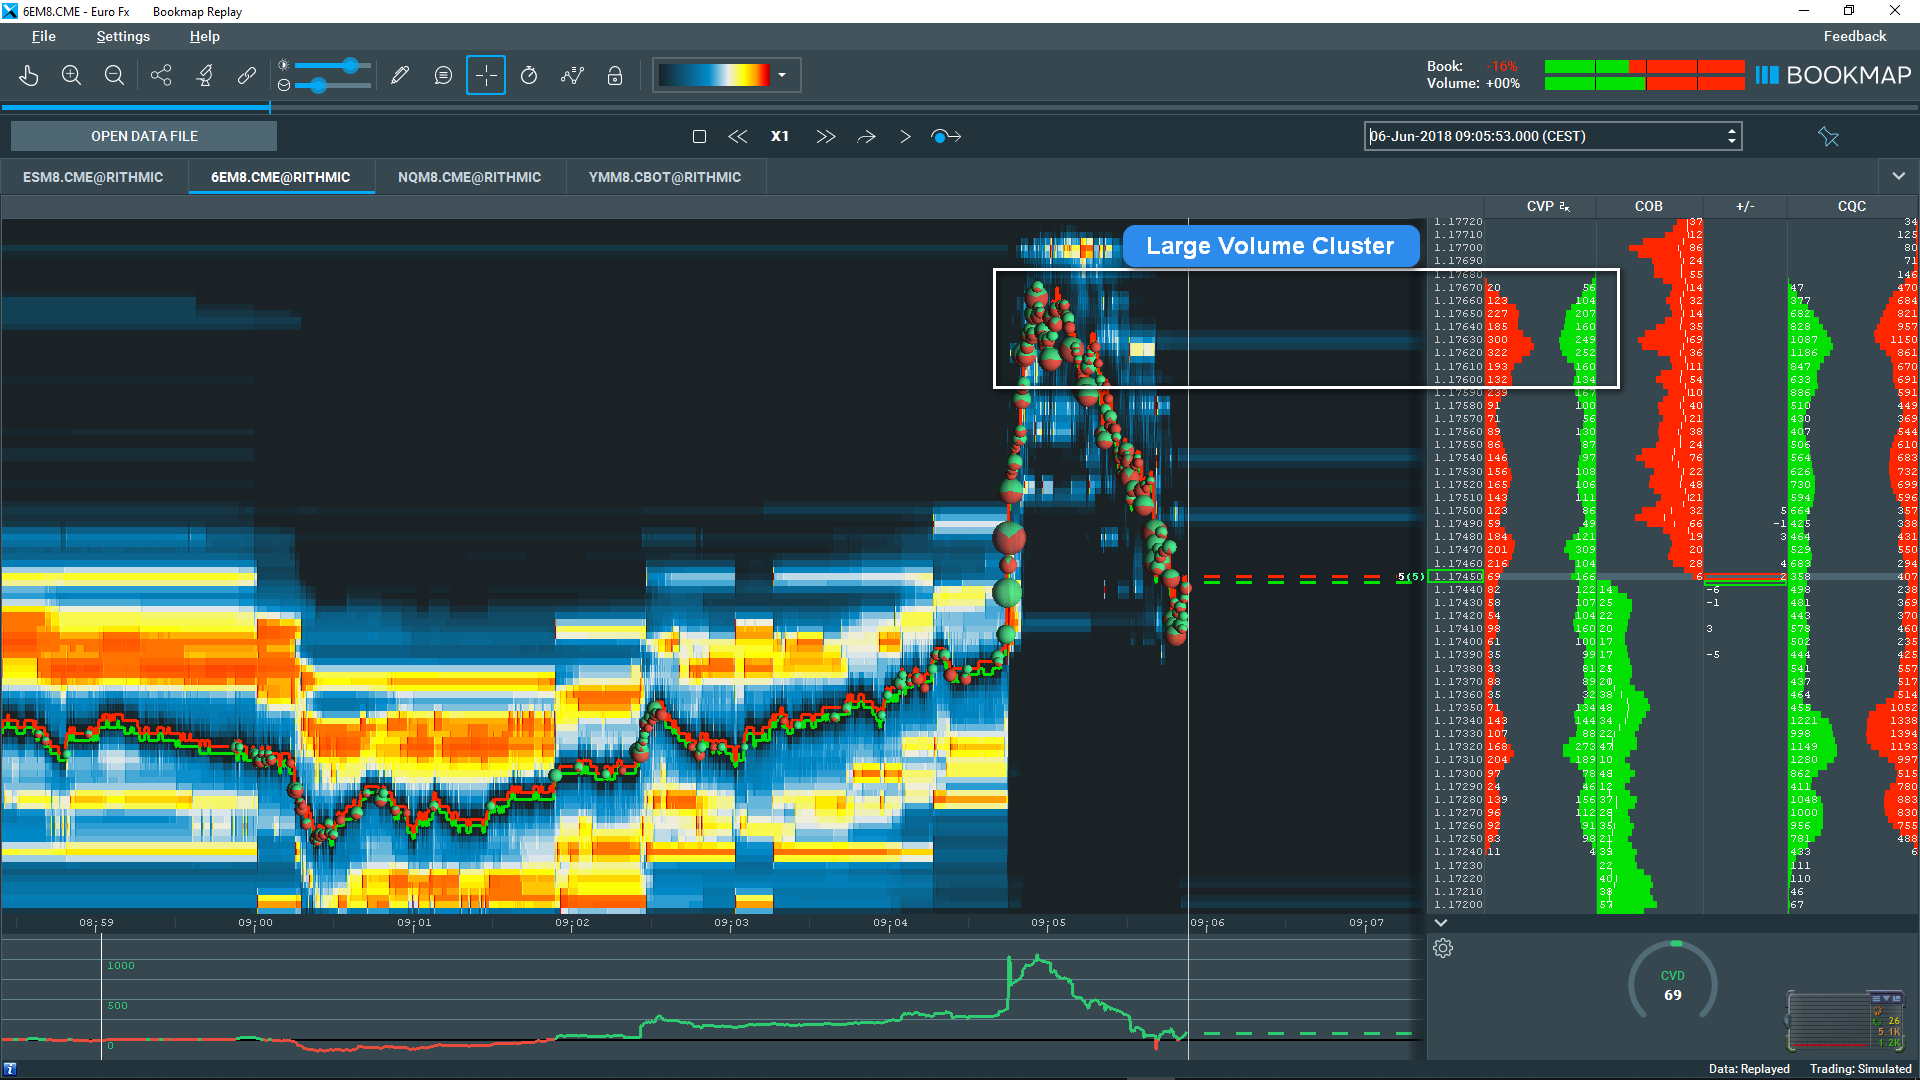
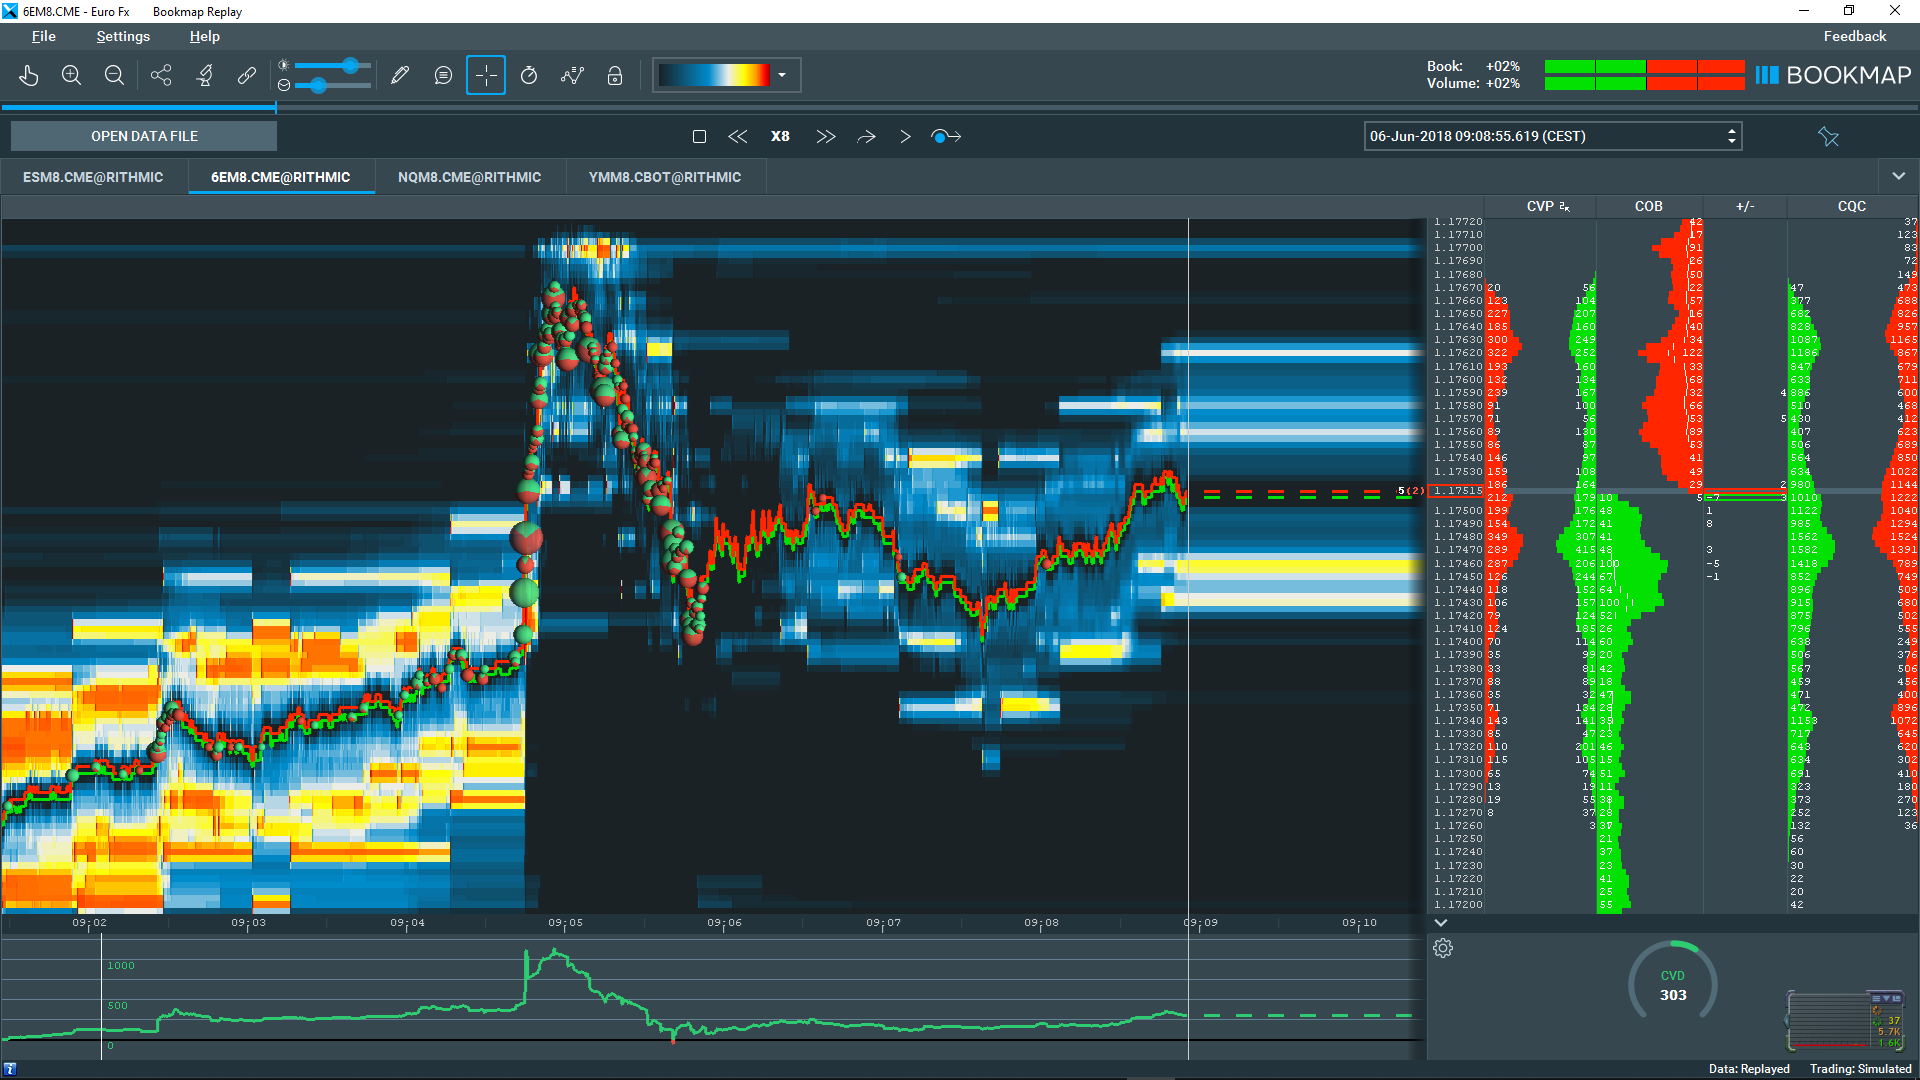
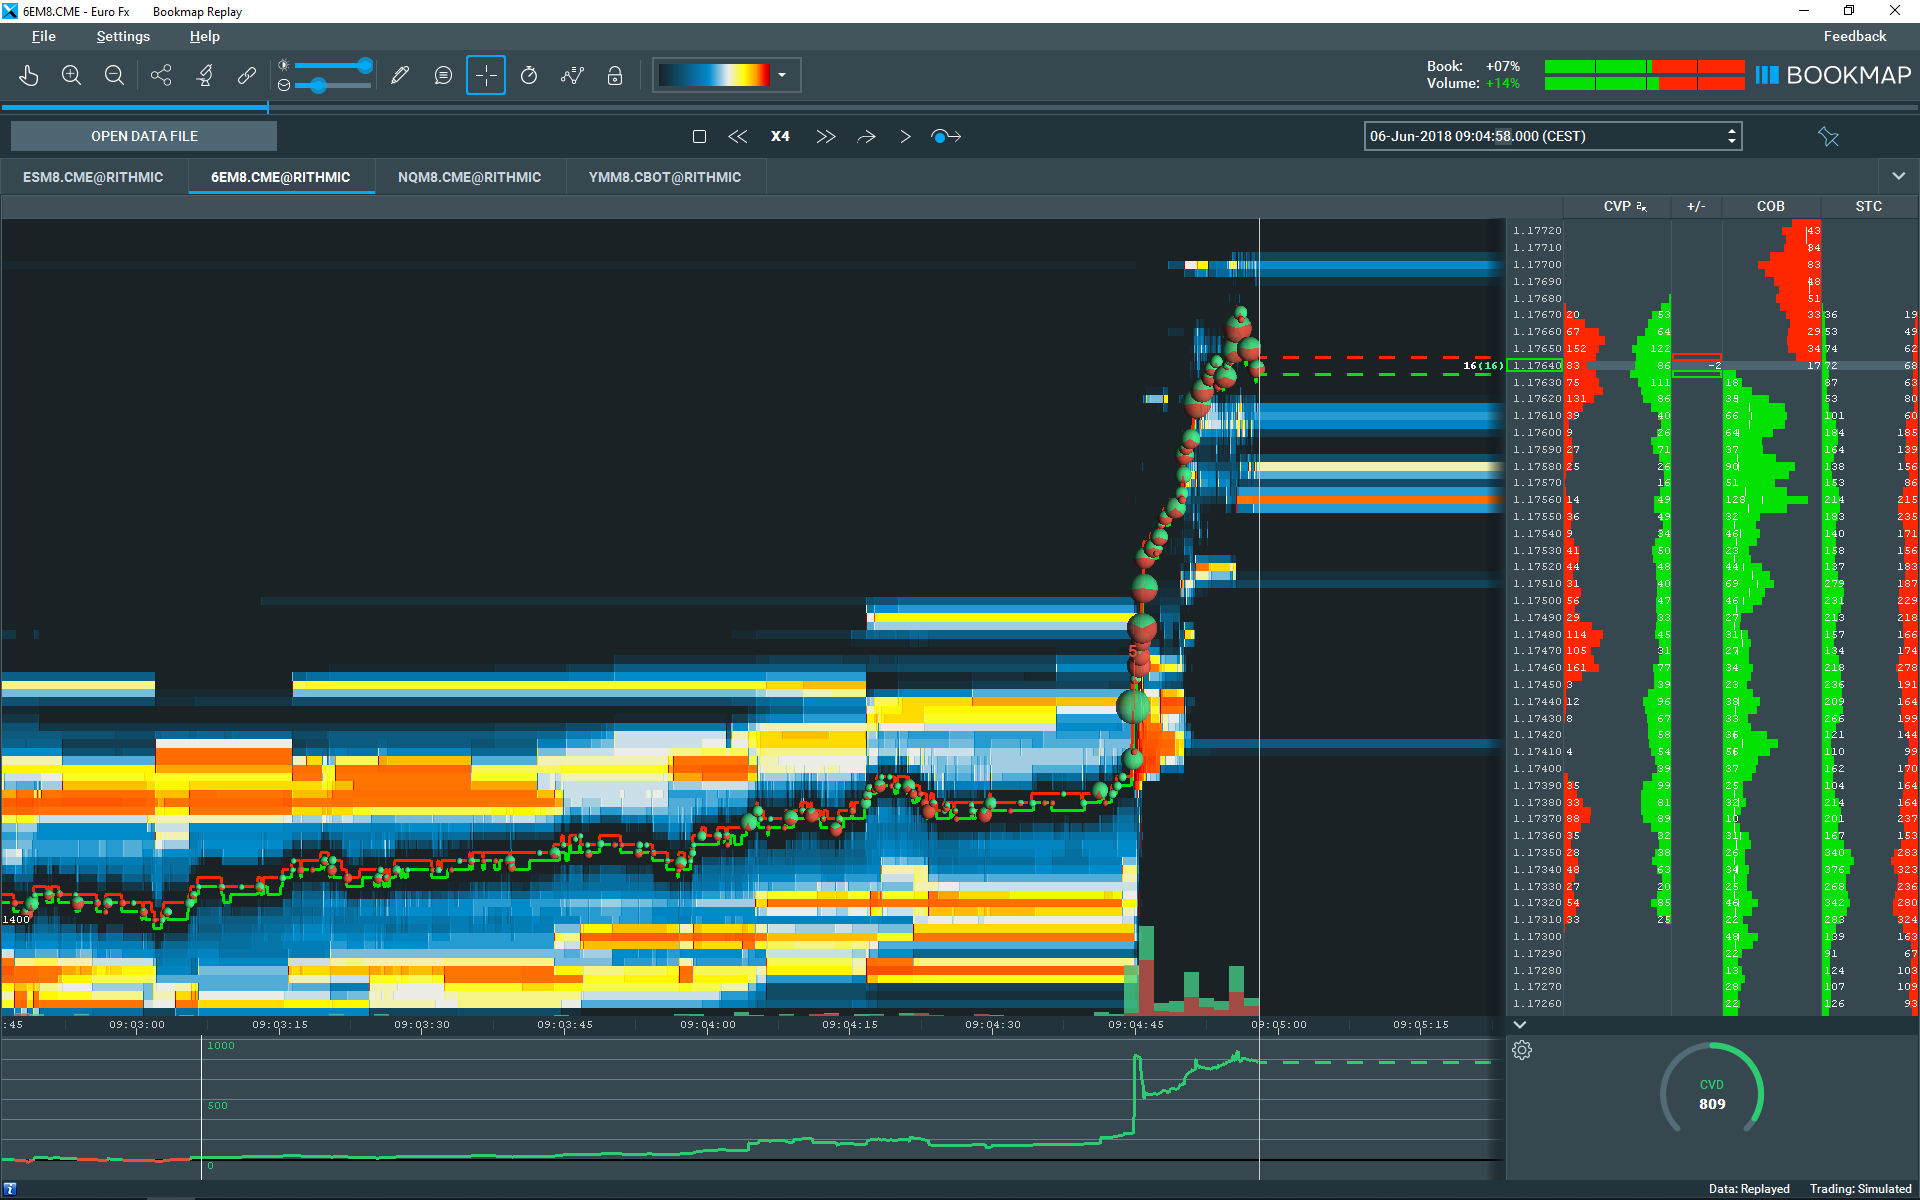
A rule of thumb is to let that moves play out! This is generally true for all large volume clusters. Although you will see and learn that moves driven by news, expected or unexpected, are slightly different from moves where big liquidity is the reason for a price stop and reversal. Screenshots above shows a sudden violent move after an ECB member speech. The move in this example started with a large euphoric buy order. Offers stepped out of the way. No significant large volume along the way up. The move ended with a large volume trading area as you can measure in the CVP row of Bookmap™ and also observe it in the size of plotted dots or circles.

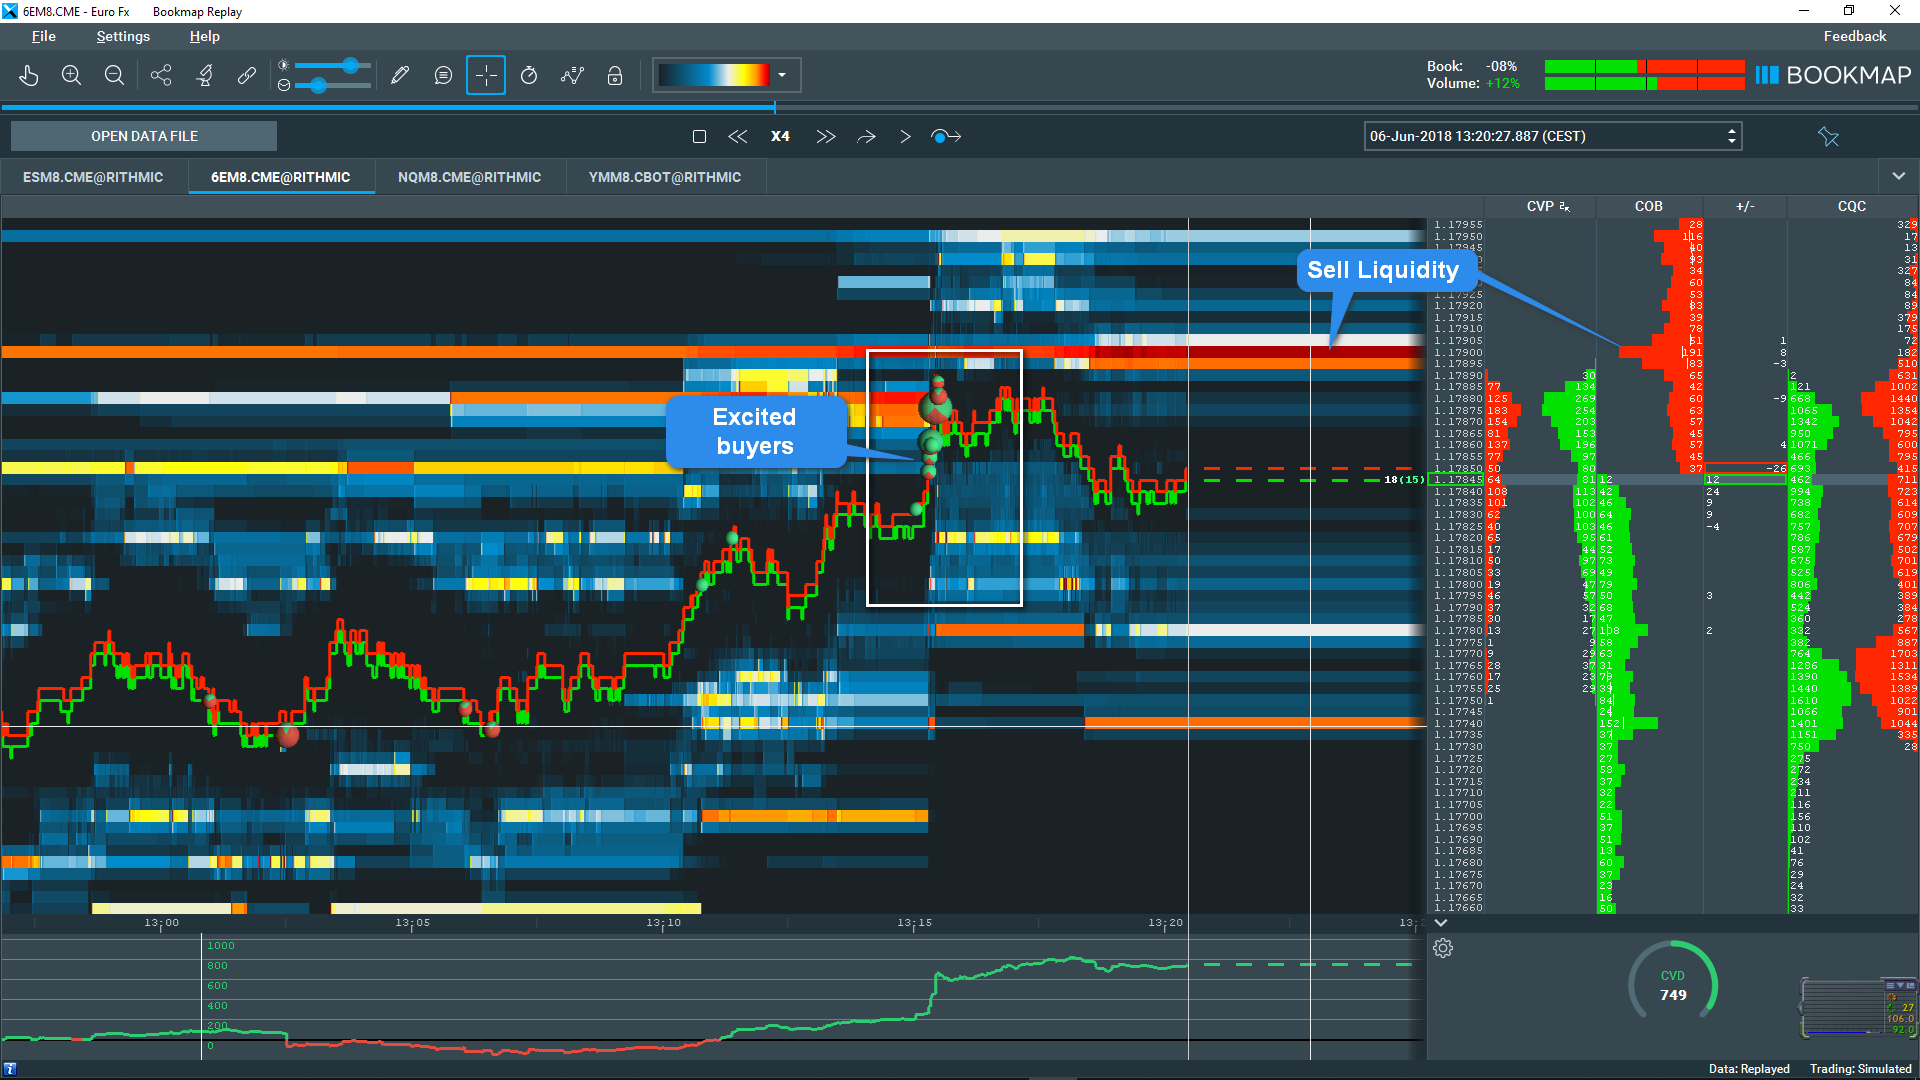
The second example is the opposite of the "News Move" as desribed above. It is more a "controlled" move although it contains all characteristics of a large volume cluster attributes. By "controlled" I mean that it happens within a trading range or trading move. This move is not violent or sudden. It strives against a liquidity area. But it is:
- controlled by the buyers
- at the end fast because offers are overruned by buyers
- attracting excited buyers
- absorbed at the liquidity level
Let's see another example.
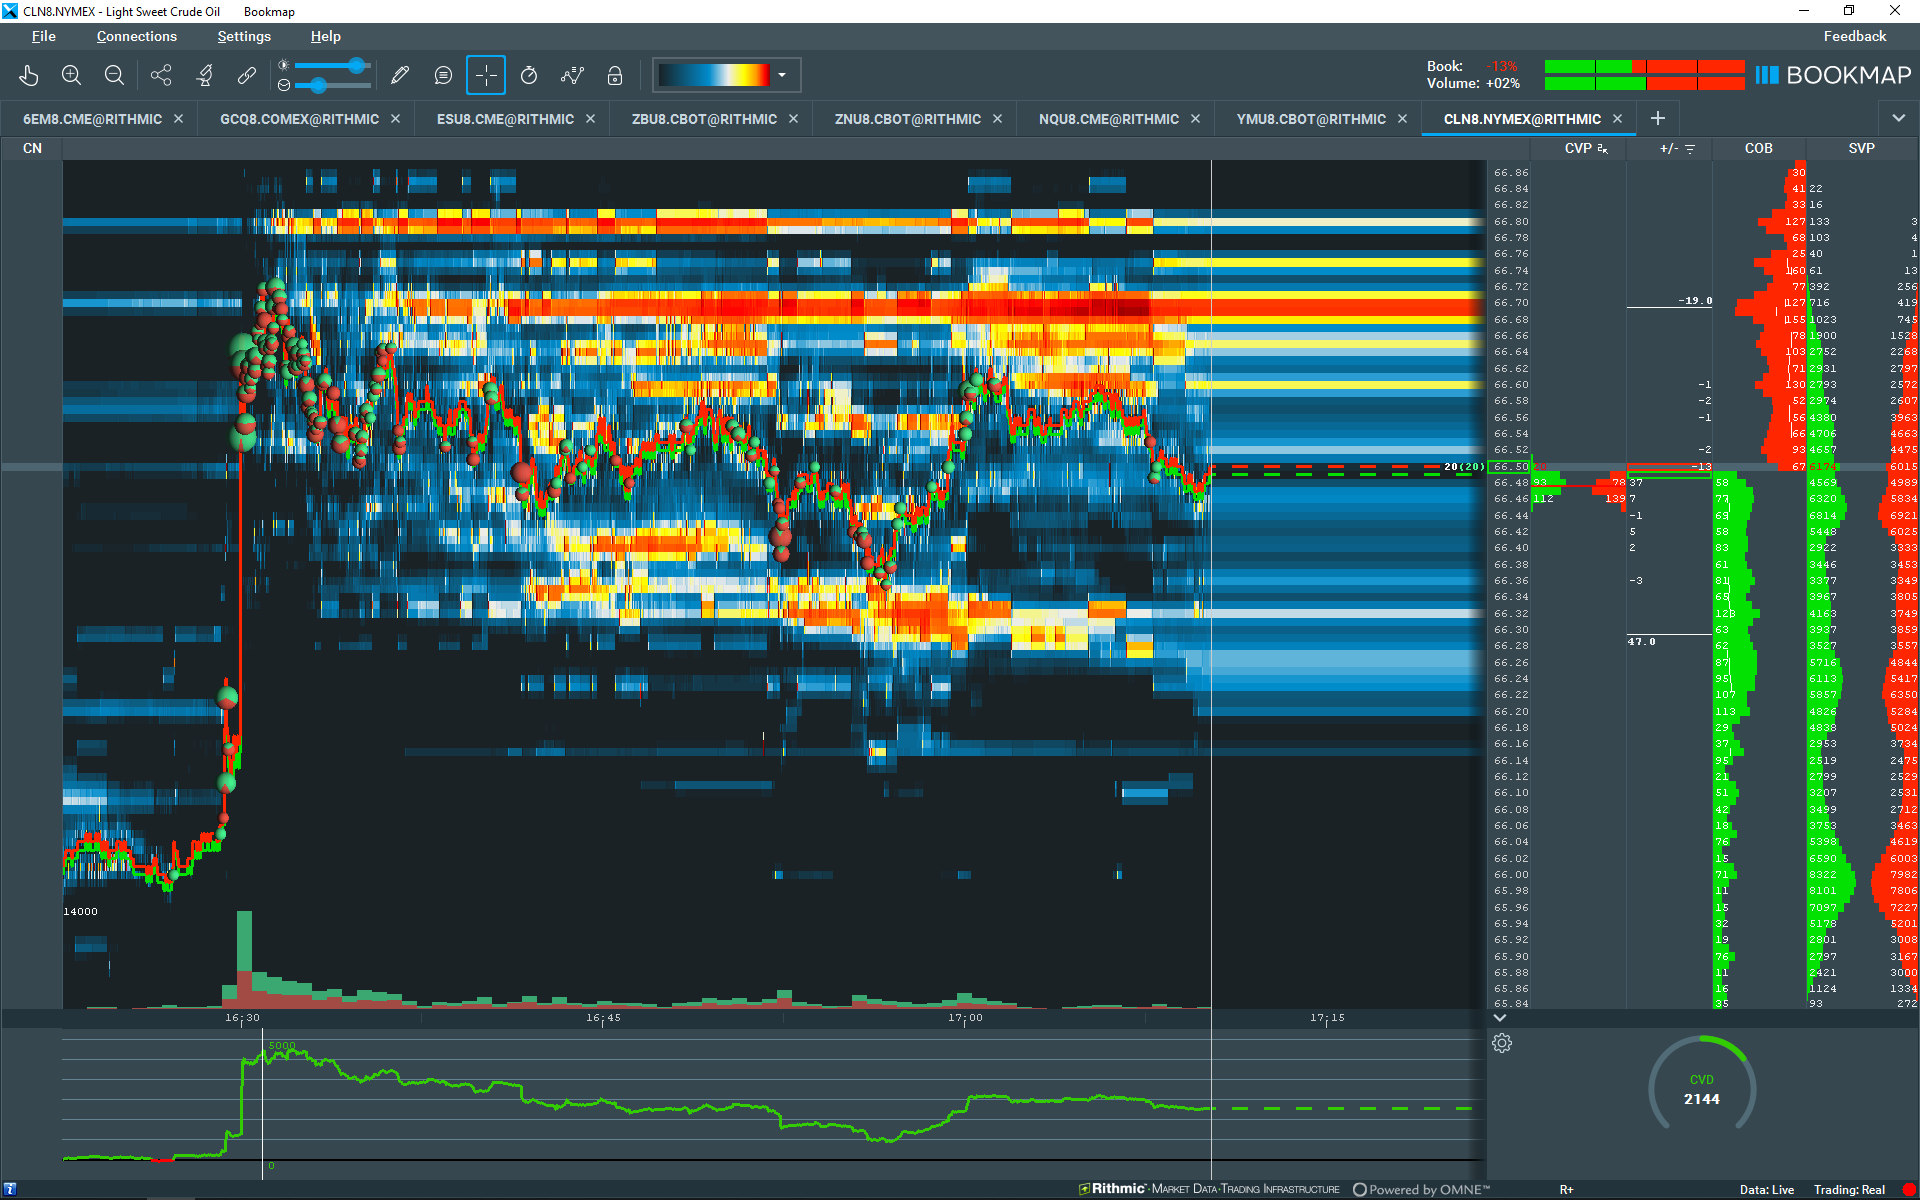
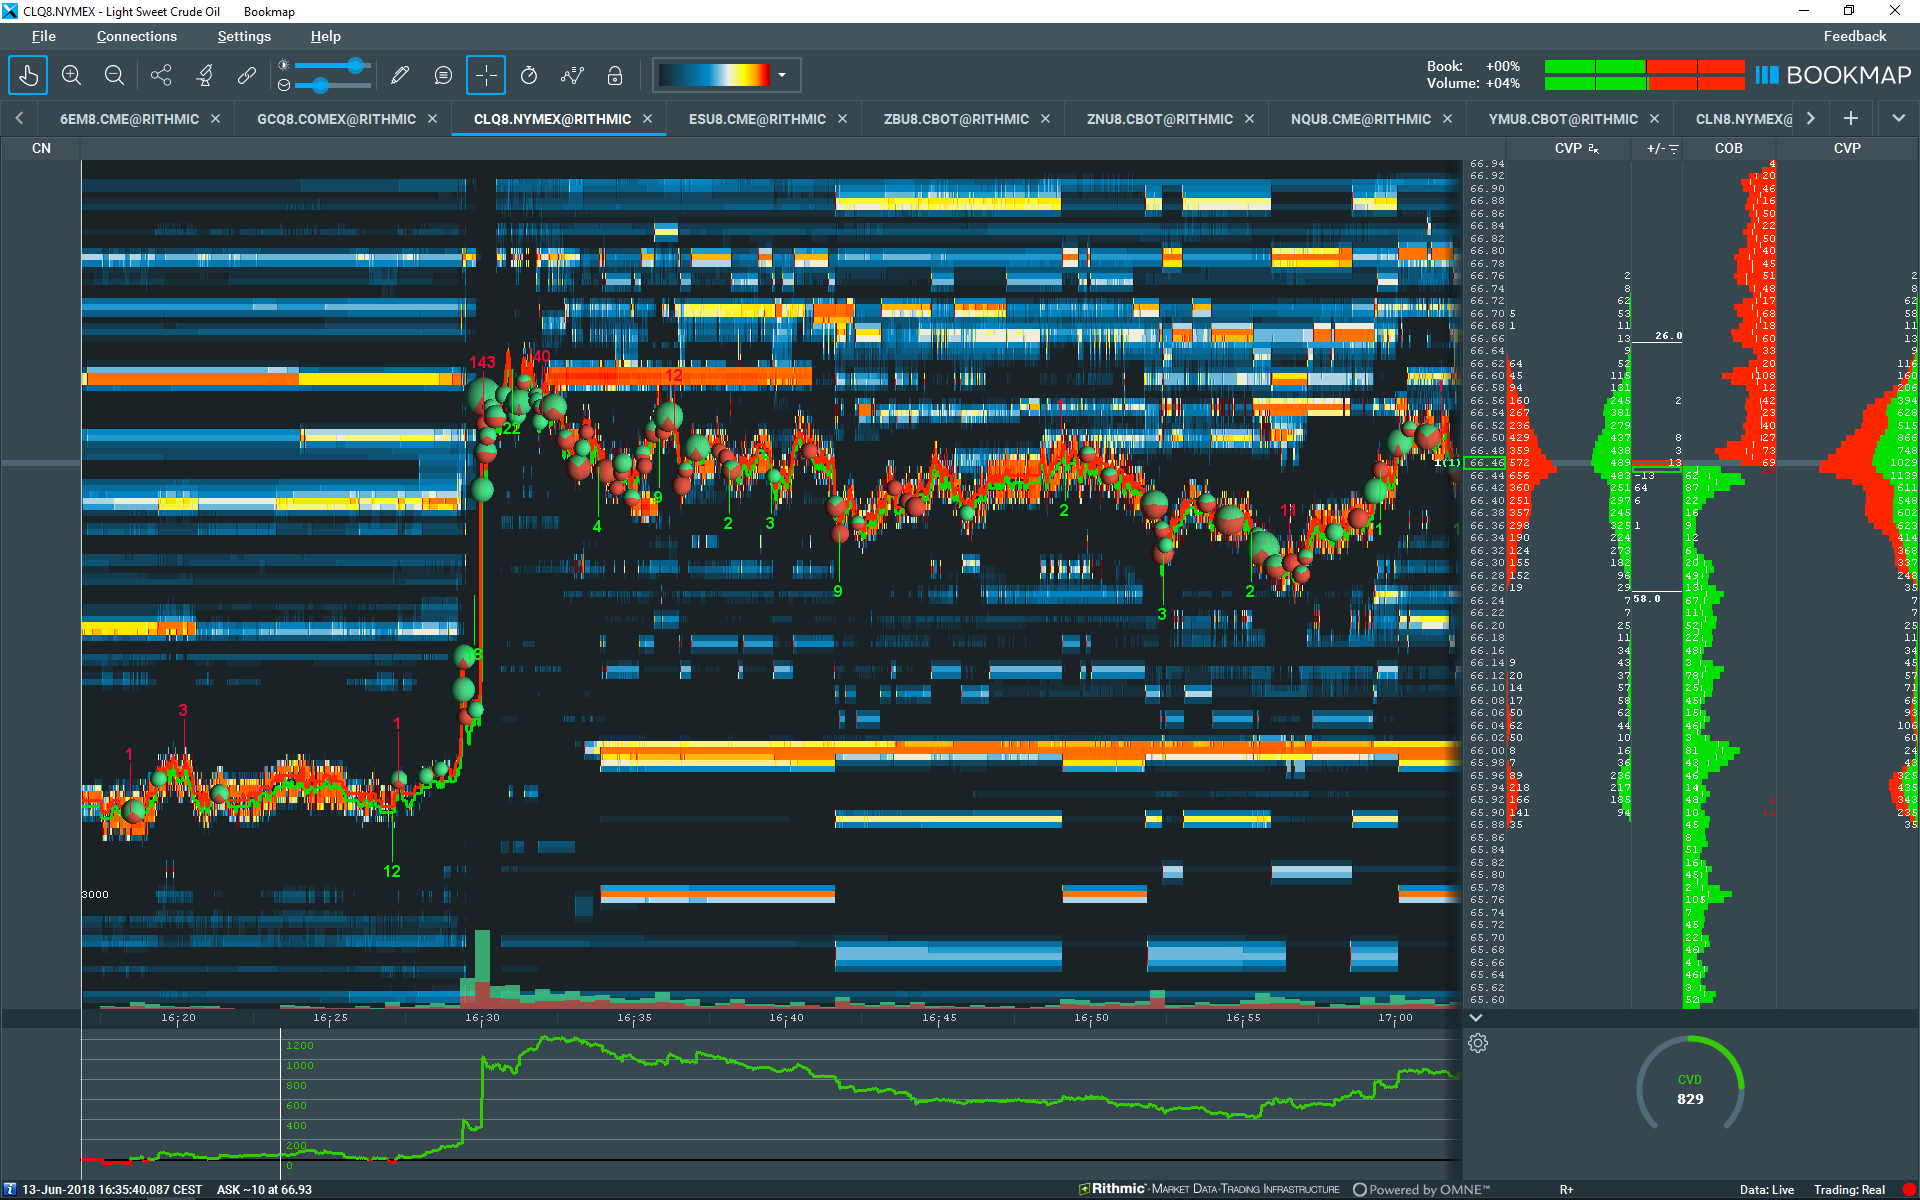

The crude oil future CL 07-18 (13 June 2018) demonstrates perfectly what large volume clusters are and how they come into being:
- controlled by the buyers
- fast because missing offers
- without exceptional volume along this move
- attracting excited buyers
How to trade
The key to trade these moves is to let that play out!
It is not neccessary to guess where the "News Move" will end and you obviously can't trade the first few dots. We do know that a move like this is not sustainable.
In an "controlled" move we will see most of the time a long term volume liquidity area below or above in the limit order book.
For all these large volume moves we can observe that when the market starts moving down the buyers are going to get stopped out.
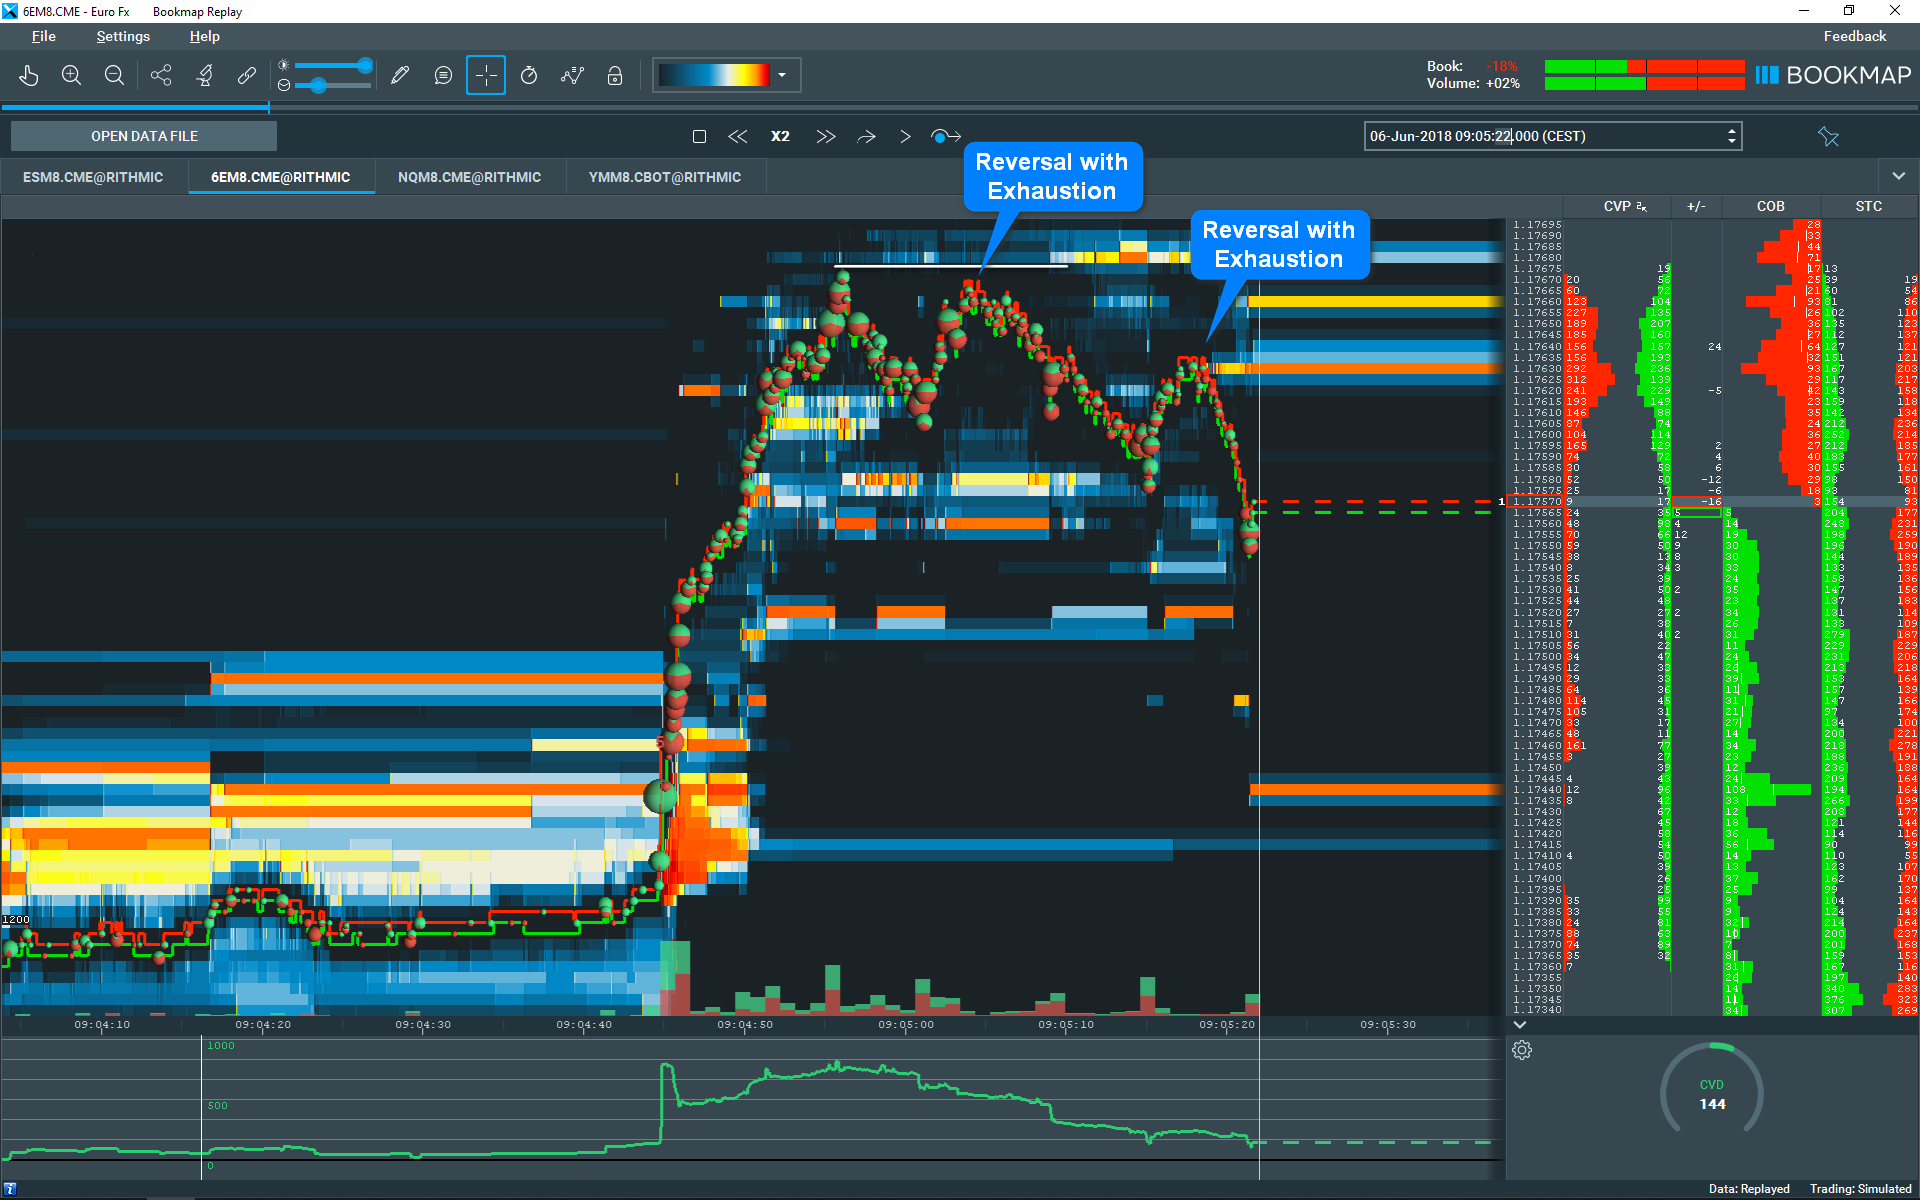
Screenshot above shows typical large volume clusters at the top and reversals which end with exhaustion. Exhaustion is beside the "Large Volume Clusters" or "High Volume Nodes" a key element for determination of reversals and is subject for a separate article.
As described above
- let the moves play out
- watch for reversals
- watch for exhaustion on reversals
- mostly accompanied by divergences
- liquidity areas above or below
- book adds more liquidity above or below
Excited Buyers
I would like to mention this phenomenon because it happens again and again. Every single day. It seems to be human nature to jump on the train when it is already moving fast. Therefore my observation why these moves accelerates is that:
Some of the late buyers will without doubt be in the market simply because they got so excited by seeing this move rushing up.
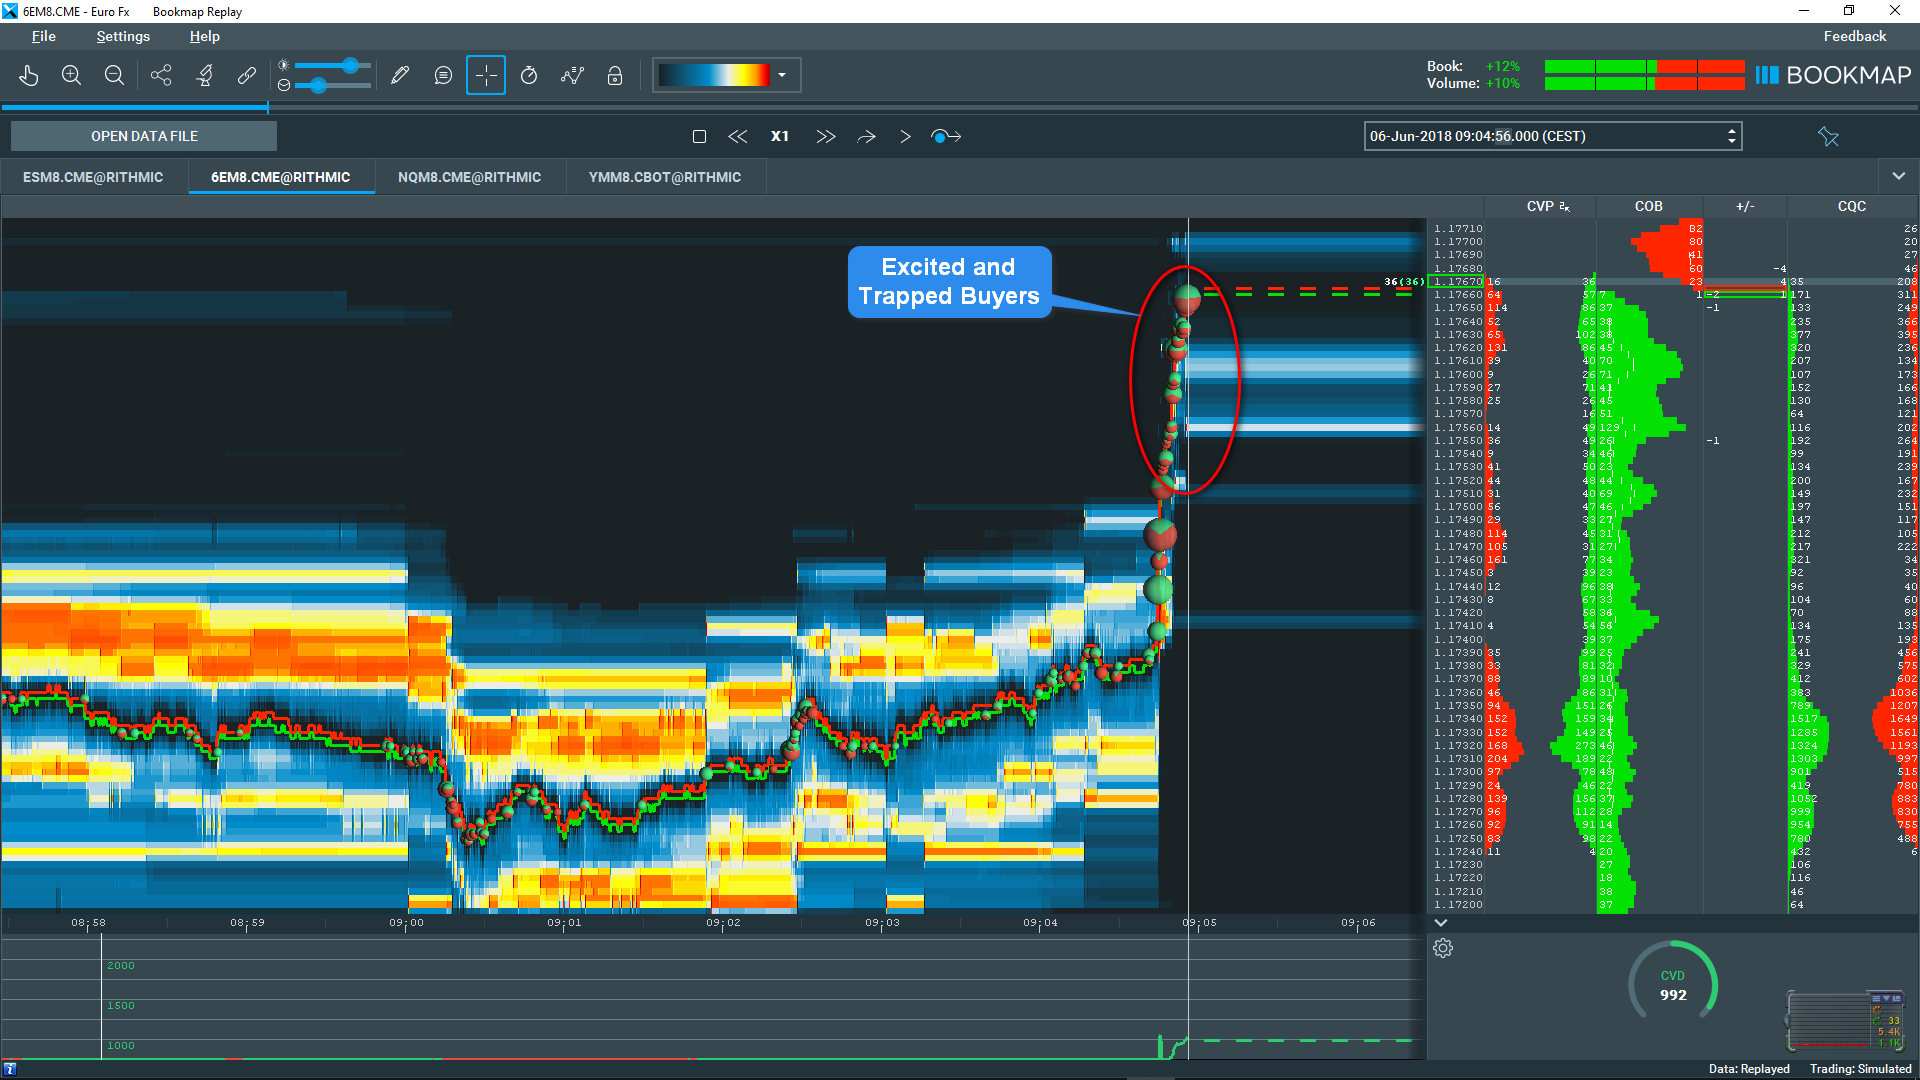
Excited buyers could go in at the start of the move but they have got to buy it because they missed something. These traders are the first traders to bail out as the market pushes down.
If you want to trade this areas then let the market move against these traders and then you have a much higher probability trade.
Conclusion
As you see in screenshots above no all areas of high volume are equal. Some are supported by high liquidity areas on the offer or bid side. Others are not as you can see in the "News Move". We must also consider that no all reversals are caused by high volume. But it is worth studying high volume areas because they really do provide clear opportunities when they occur.
Volume cluster analysis is one of the most truly impartial methods of technical valuation, offering the possibility of uncovering and specifying the level of support and resistance, estimating the trend response (value or volume) or additionally confirming the existing pricing model.
All samples recorded with Bookmap™.


Comments