
Objectivity in Trading

Hypothesis: Profitable trading decisions are based on objective trading information.
"Ahh, Come on. You are kidding. Trading is speculation, gamling, coincidence, randomness!"
To a certain extend you are right. We, human beings, made it gambling and we like it! Look the people who are currently gambling with Bitcoin or on diverse Forex platforms.
Hold on! Take a deep breath and check whether my hypothetical approach has something substancial.
Are objective trading information possible at all?
Please consider that we already have three constant trading values:
Price, Time, Volume.
These constants are true like Gravitiy, Pi, e=mc². They are not debatable!
The speculation starts here: "Where is the price going next?". It is our human nature and our curiuosity that want to know what is going to happen in the future. This is leading to so much disorientation and babylonian confusion because everyone has something to say about trading, how it works, how to forecast and what to do best.
My please is to follow my logic and see if you will get an additional idea which help you to improve your trading. In this article I am not talking about the psychological aspect of trading but you'll see how data presentation can ease the psychological pressure we are facing every day in trading.
Let's play.

Take a simple Candle Chart, whatever instrument you want, and show it, without any comment, to let' say 10 people. Your audience should give spontanious answers to what they see on this chart.
It is funny and I bet, you'll get more then 10 different ideas what's on the chart: Rectangles, channels, congestions, support, fibonacci retracements, Harami, Dojis, higher low, lower highs, trend channel, break out, chaos, nothing to see, don't know, etc. etc..
At the end ask your audience where the price is moving next.
Daniel Kahneman
If you agree with me or not at this stage, I want to URGE everyone - trader or not - to read Daniel Kahneman's book "Thinking, Fast and Slow" .
Kahneman / Tversky reveals in their studies how our thinking is organized. Why we shouldn't trust our intuition and our search for simple solutions.
Example:
How much is 7x7? Easy, isn't it!
How much is 243 x 873? Huuh!! To get the right answer you need time and energy to calculate. It's not intuitive. When you read the sentence: "How much is 243 x 873?" you may felt a little bit uncomfortable.
We don't like complexity, uncertanity. Most of us are striving for easy to digest solutions, freedom, simplicity. Our subjective perception and the fear of loss is the reason why we strive to reduce the complexity in nearly everything we do.
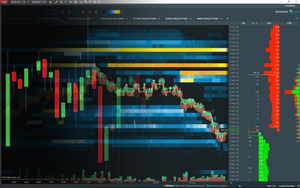
Coming back to trading. In this gallery you see some of the "7x7" charts.
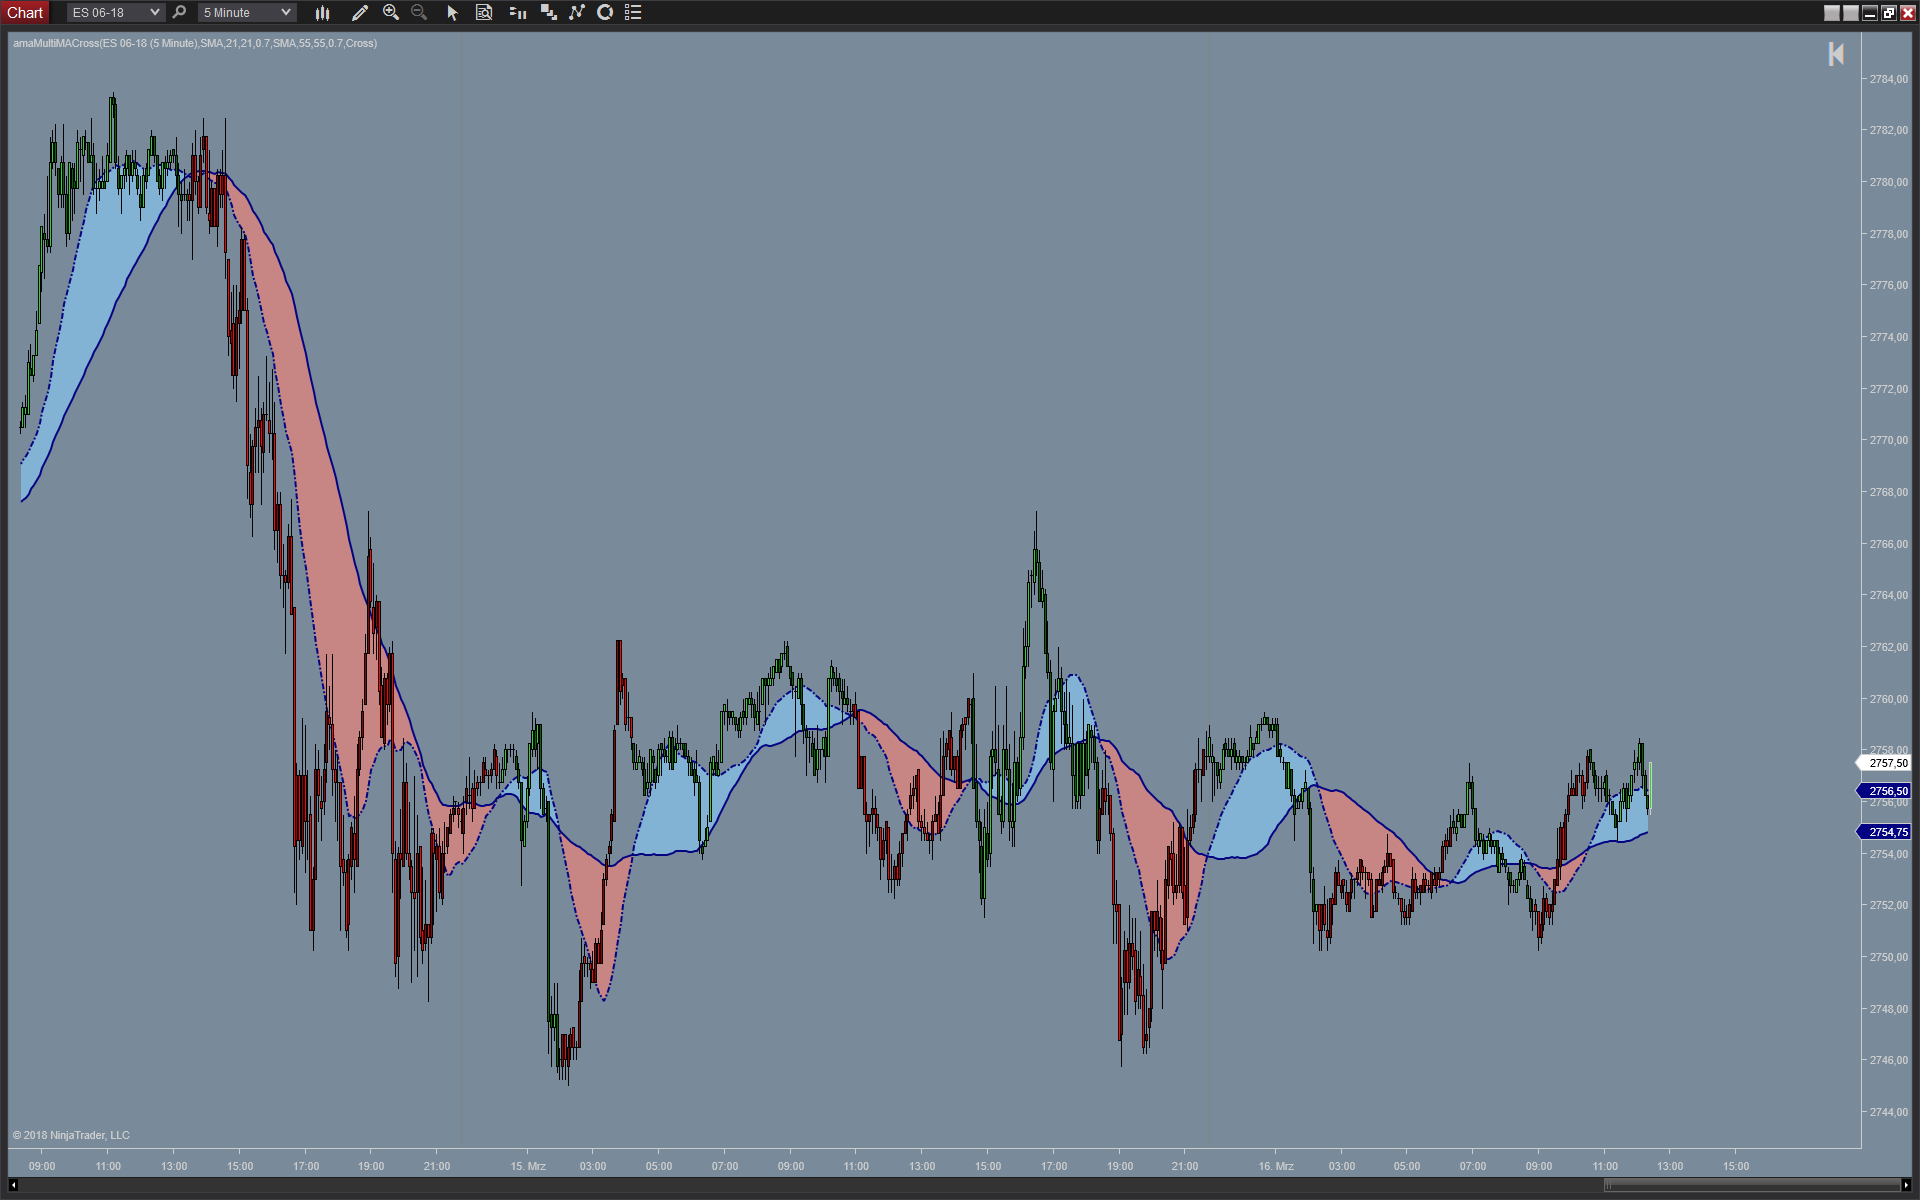
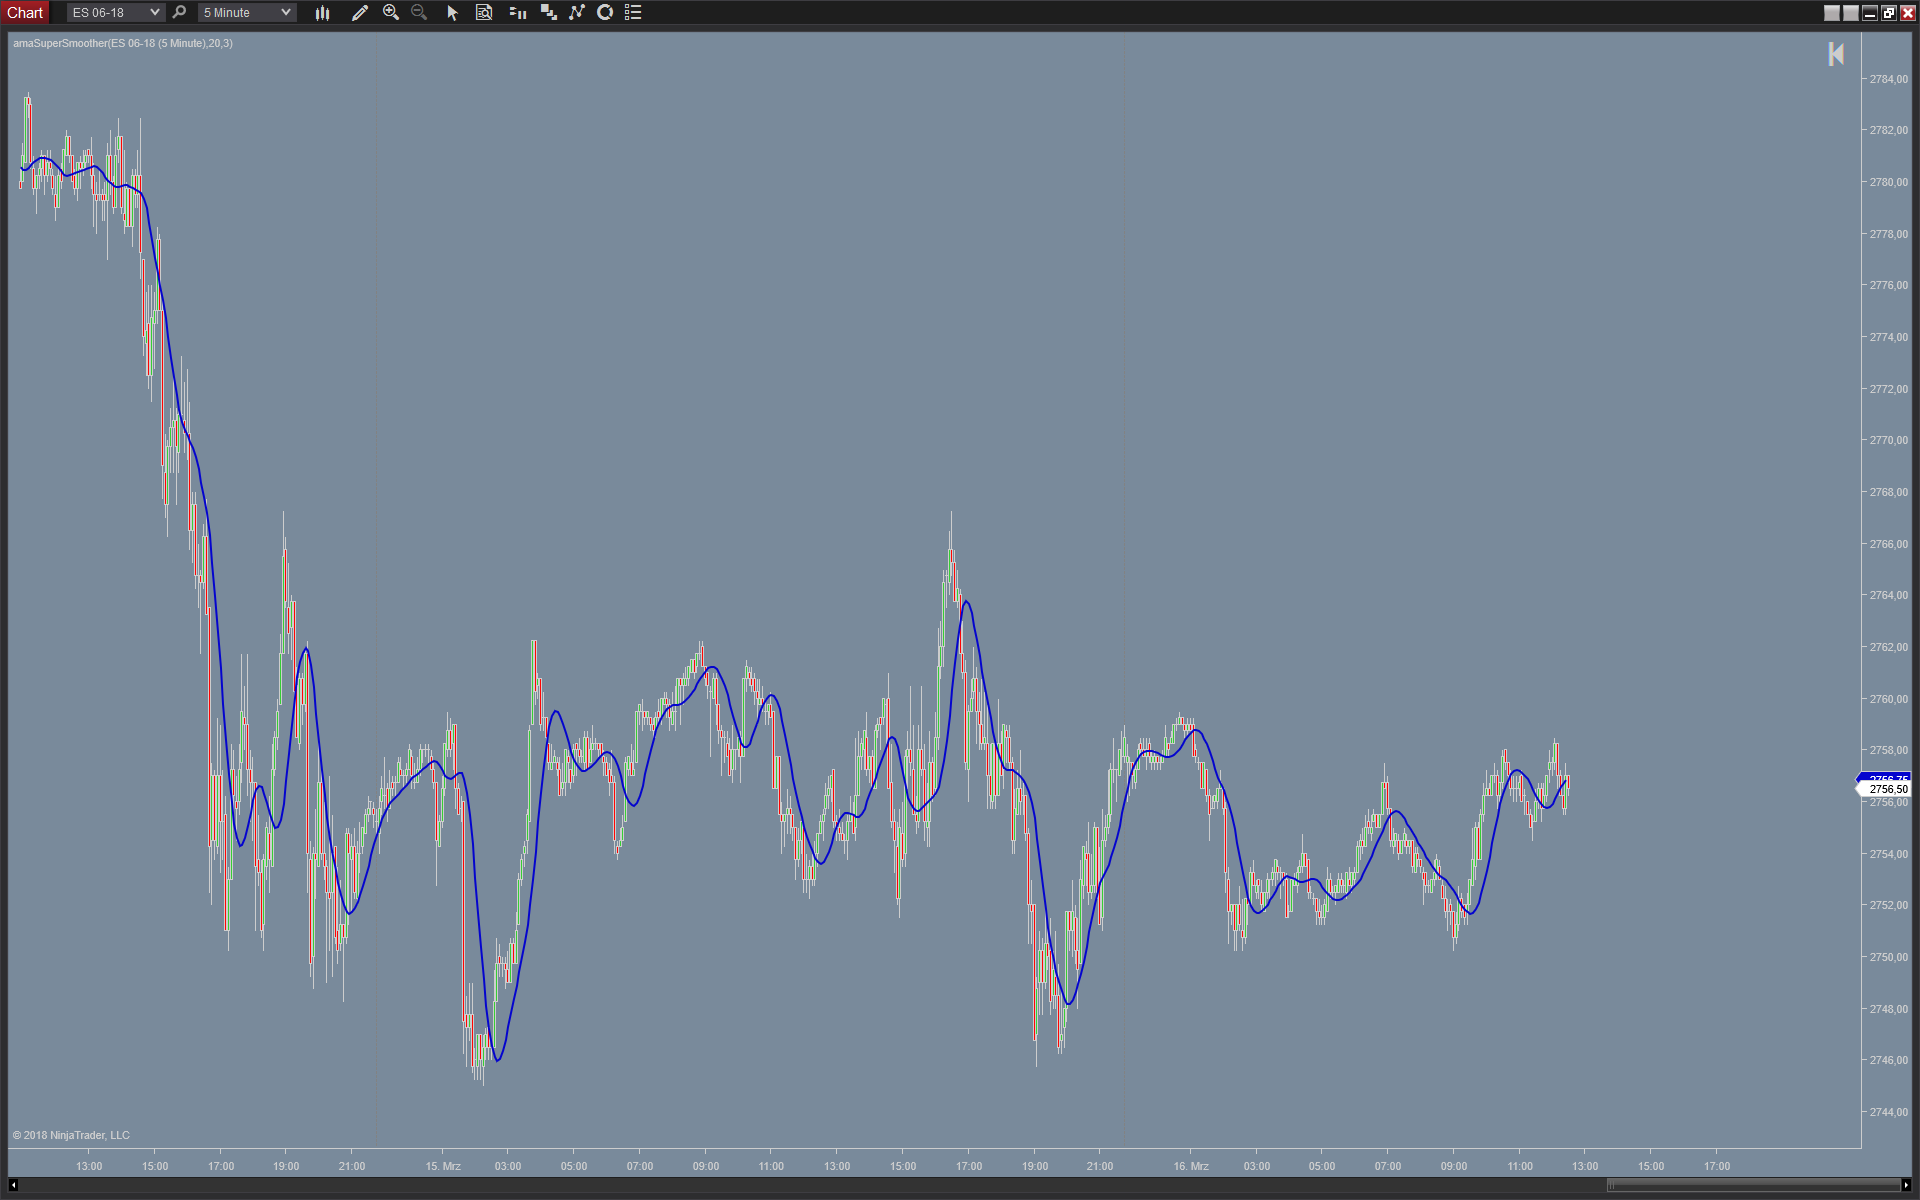

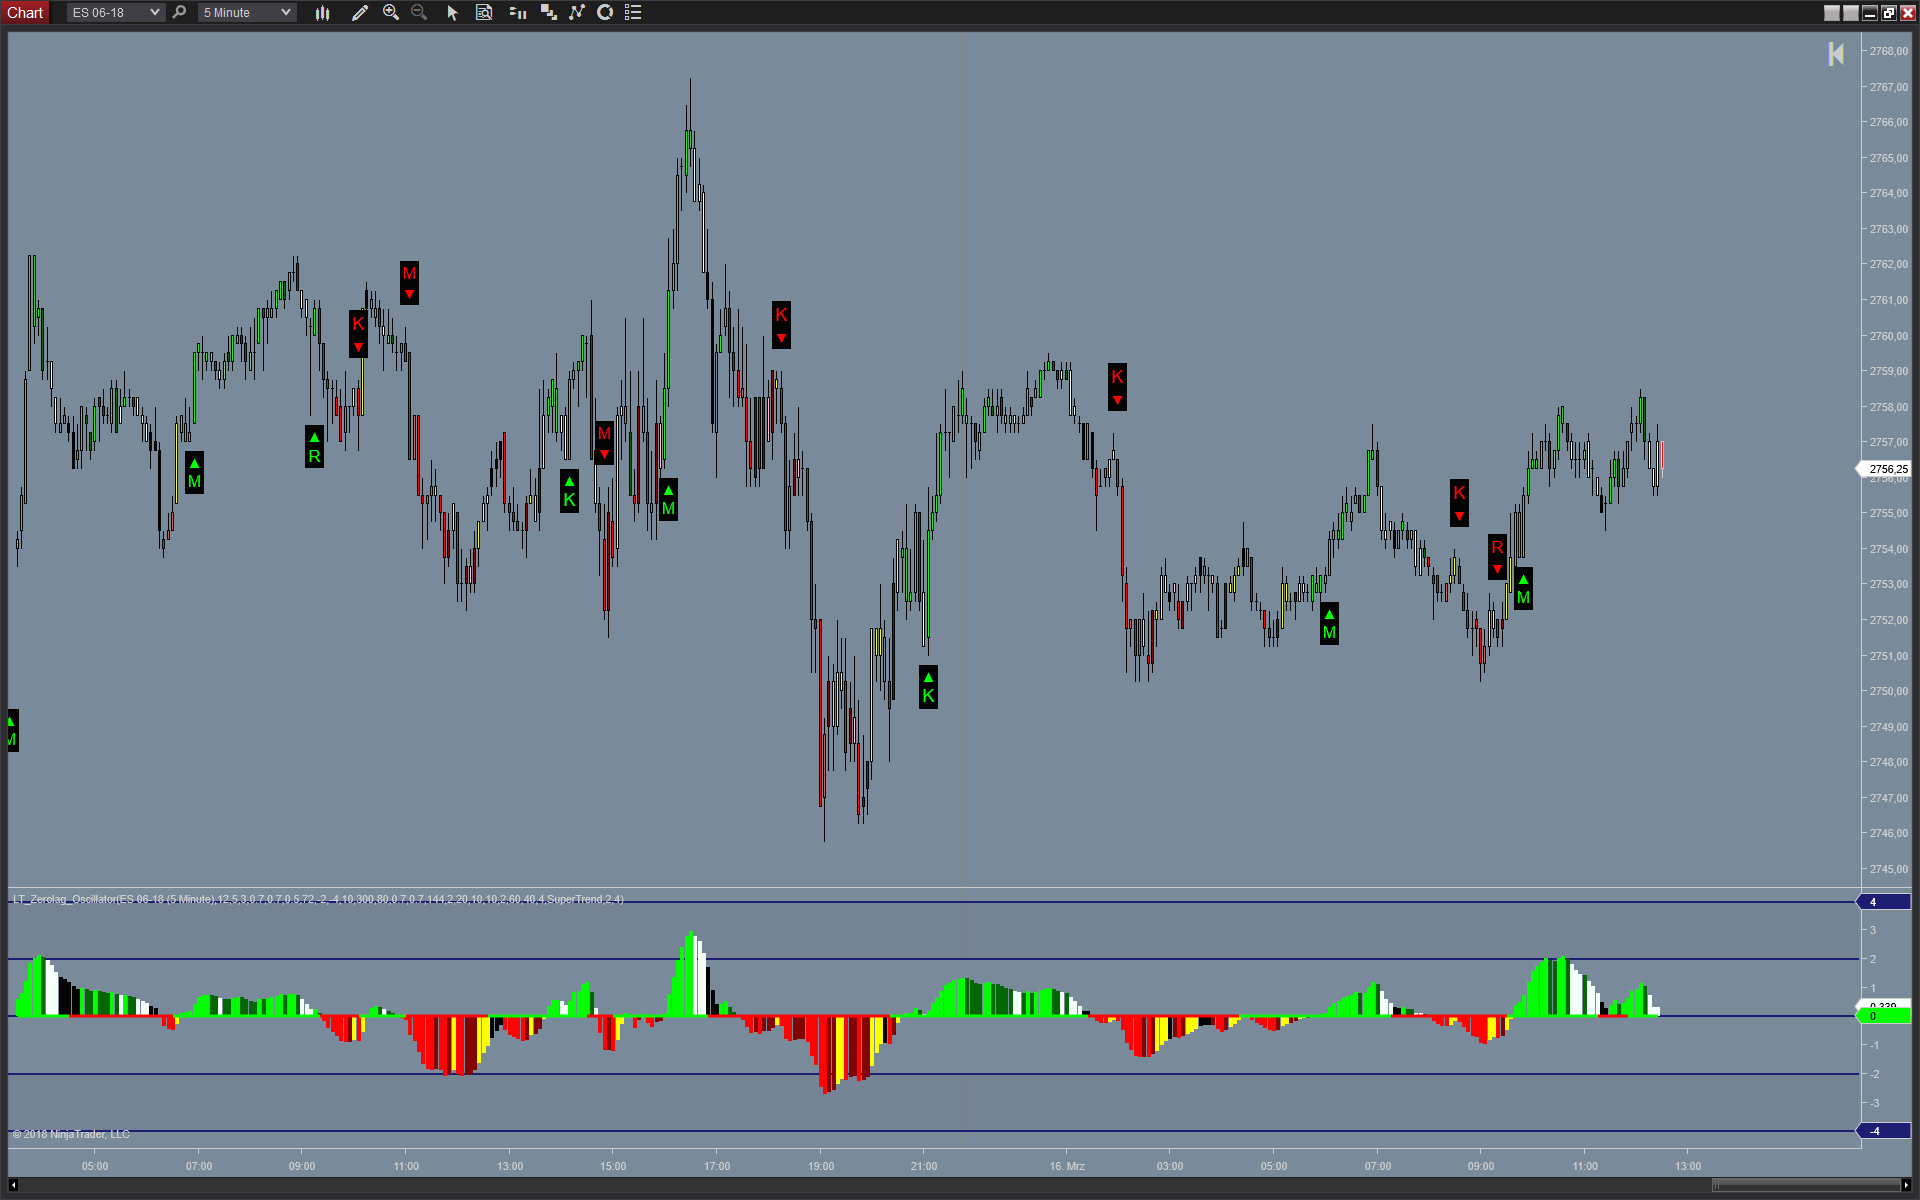
Please note: I am not criticizing any indicator! And I am not saying that this and thousand other charts couldn't be traded. They even can be automated via strategies which at least help to reduce or remove human error. Indicators by Lizardindicators.com.
During my long lasting "education" as trader I asked myself all the time:
"Are lines, percentage levels, time levels, mathematical or other patterns, indicators constructions, labeled candles, clouds, etc. really objective informations or are they constructs, crutches, based on past information to make my decision "7x7" like?"
This excerpt from Dr. Brett Steenbarger published in Forbes describes it excellently:
"Elite traders in financial markets are extraordinarily gifted in one or the other of these information processing modes--and often both. Some are phenomenal pattern recognizers with unusually fast perception and response times (common among shorter-term participants). Others are unusually skilled data analysts, able to uncover meaningful relationships among variables that predict market outcomes (common among longer-term participants). When we look at how these talented individuals actually conduct their work, we often see both fast and slow information processing modes operating in harmony, as with the poker champion. For example, the rapid daytrader will notice an economic data release and will realize the implications for particular industries. This analytical insight will then fuel short-term trades that take advantage of the fact that others have not yet digested the data. Similarly, the longer-term portfolio manager will have a well-researched view, but can detect when other market participants, who have been leaning the wrong way, are now taking the other side. That creates an unusual opportunity to size up the position.
In both cases, the elite traders succeed because they see things that others miss, and that is a function of how they process information, not just their personality traits."
Source of Information
Source information in trading is the realtime traded data information as described in Market Data Platform Protocol 3.0 (MDP 3.0) or similar protocols provided by other exchanges. According CME: "Market data is used to transmit market events such as bids, offers, and trades as well as instrument information and market statistics."
This is the real data source for all trading information! It reveals how many contracts are traded, want to be traded, are being cancelled, are being added, how many contracts are sitting on the limit side at each price!
And that's excatly what I want to see:
Which auction site is dominant? Which site is adding, cancelling contracts? How strong is the limit side? How many market orders were processed? On which site? Is liquidity around? Where is liquidity? Who is manipulating?
Concerning the time factor: Are there activities right now? Does anyone trade? Is the business done for the day?
In comparison when I look on a candle I see aggregated or limited information: Open High Low Close (OHLC). Ok, we also have: Renko, Range, Tick, Volume, Kagi, Volume Bars, Heiken Ashi, etc.
All this information is provided through the Data Message Protocol or similar protocols every exchange is sending to your charting program individually dependent on what type of data (Level I, Level II) you are subscribed.
Objectivenes in trading lies in the provided source data from your exchange!
It has to do with data presentation and with "data mining". According Wikipedia data mining is defined:
Data mining is the process of discovering patterns in large data sets involving methods at the intersection of machine learning, statistics, and database systems. It is an essential process where intelligent methods are applied to extract data patterns. It is an interdisciplinary subfield of computer science. The overall goal of the data mining process is to extract information from a data set and transform it into an understandable structure for further use.
Data Presentation (*)
Market data typically consists of 90-97% of market depth updates (order book) and the rest is trades data. This is why observing market depth is so important. But that also implies technological challenges. Note that most trading charts don’t need to handle market depth data and even the trades data is being aggregated into candlesticks. Even if those charts display DoM, they need to handle only the current snapshot of market depth.
Visualization plays a key role in understanding what is really happening. It encourages making better and more educated decisions. Looking at data in a pictorial or graphical format enables us to grasp difficult concepts with greater ease or identify patterns that are otherwise unobservable. It also helps us to ask questions we did not ask before.
When dealing with market data, I see the use of visualization in the following scenarios:
- At an early stage when cleaning and ‘checking’ the market data. In many cases, wrong decisions are taken because the market data is not accurate. Therefore, visualization should be considered at that stage.
- When developing a new strategy or refining an existing one. In other words, when ‘teaching the computer’ what to do. Looking at visualized market data can also be beneficial in getting new ideas.
- When trading live and facing the need to take immediate decisions.
- When monitoring the market in real time and taking the following decisions: whether to trade or not in certain market conditions or even see that your strategy is ‘not aligned’ and needs to be stopped.
In all of the above scenarios, having the right tools is vital.
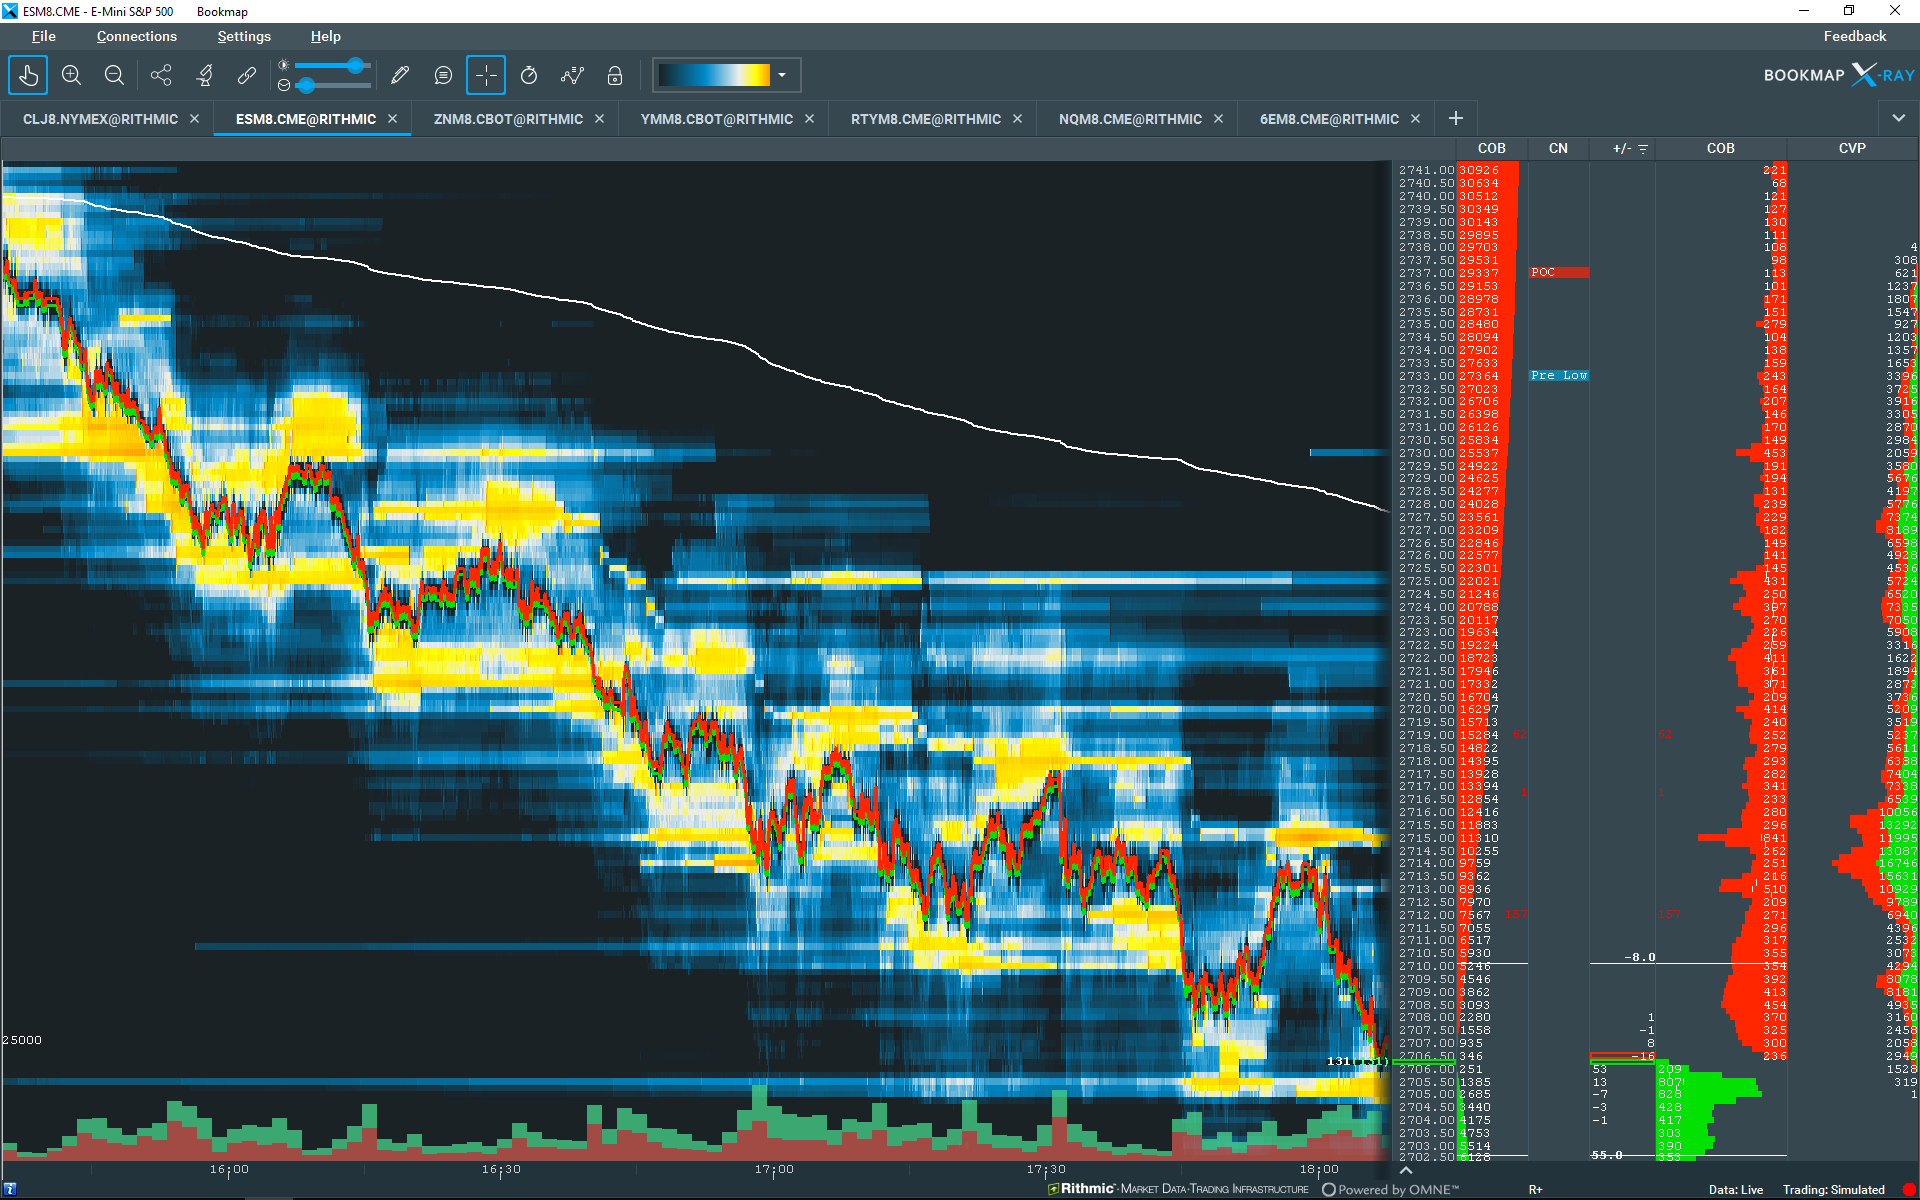
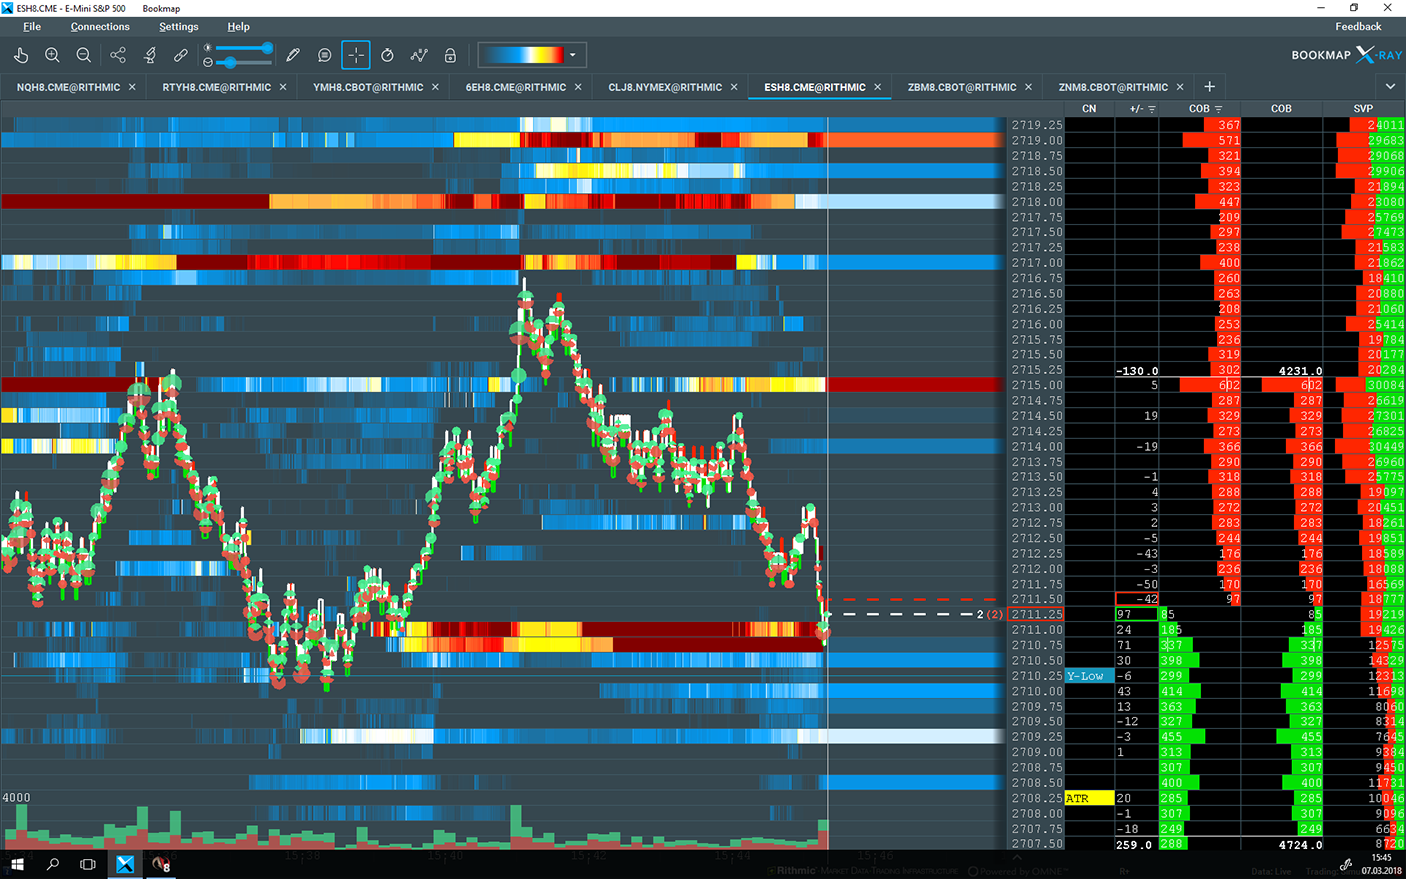
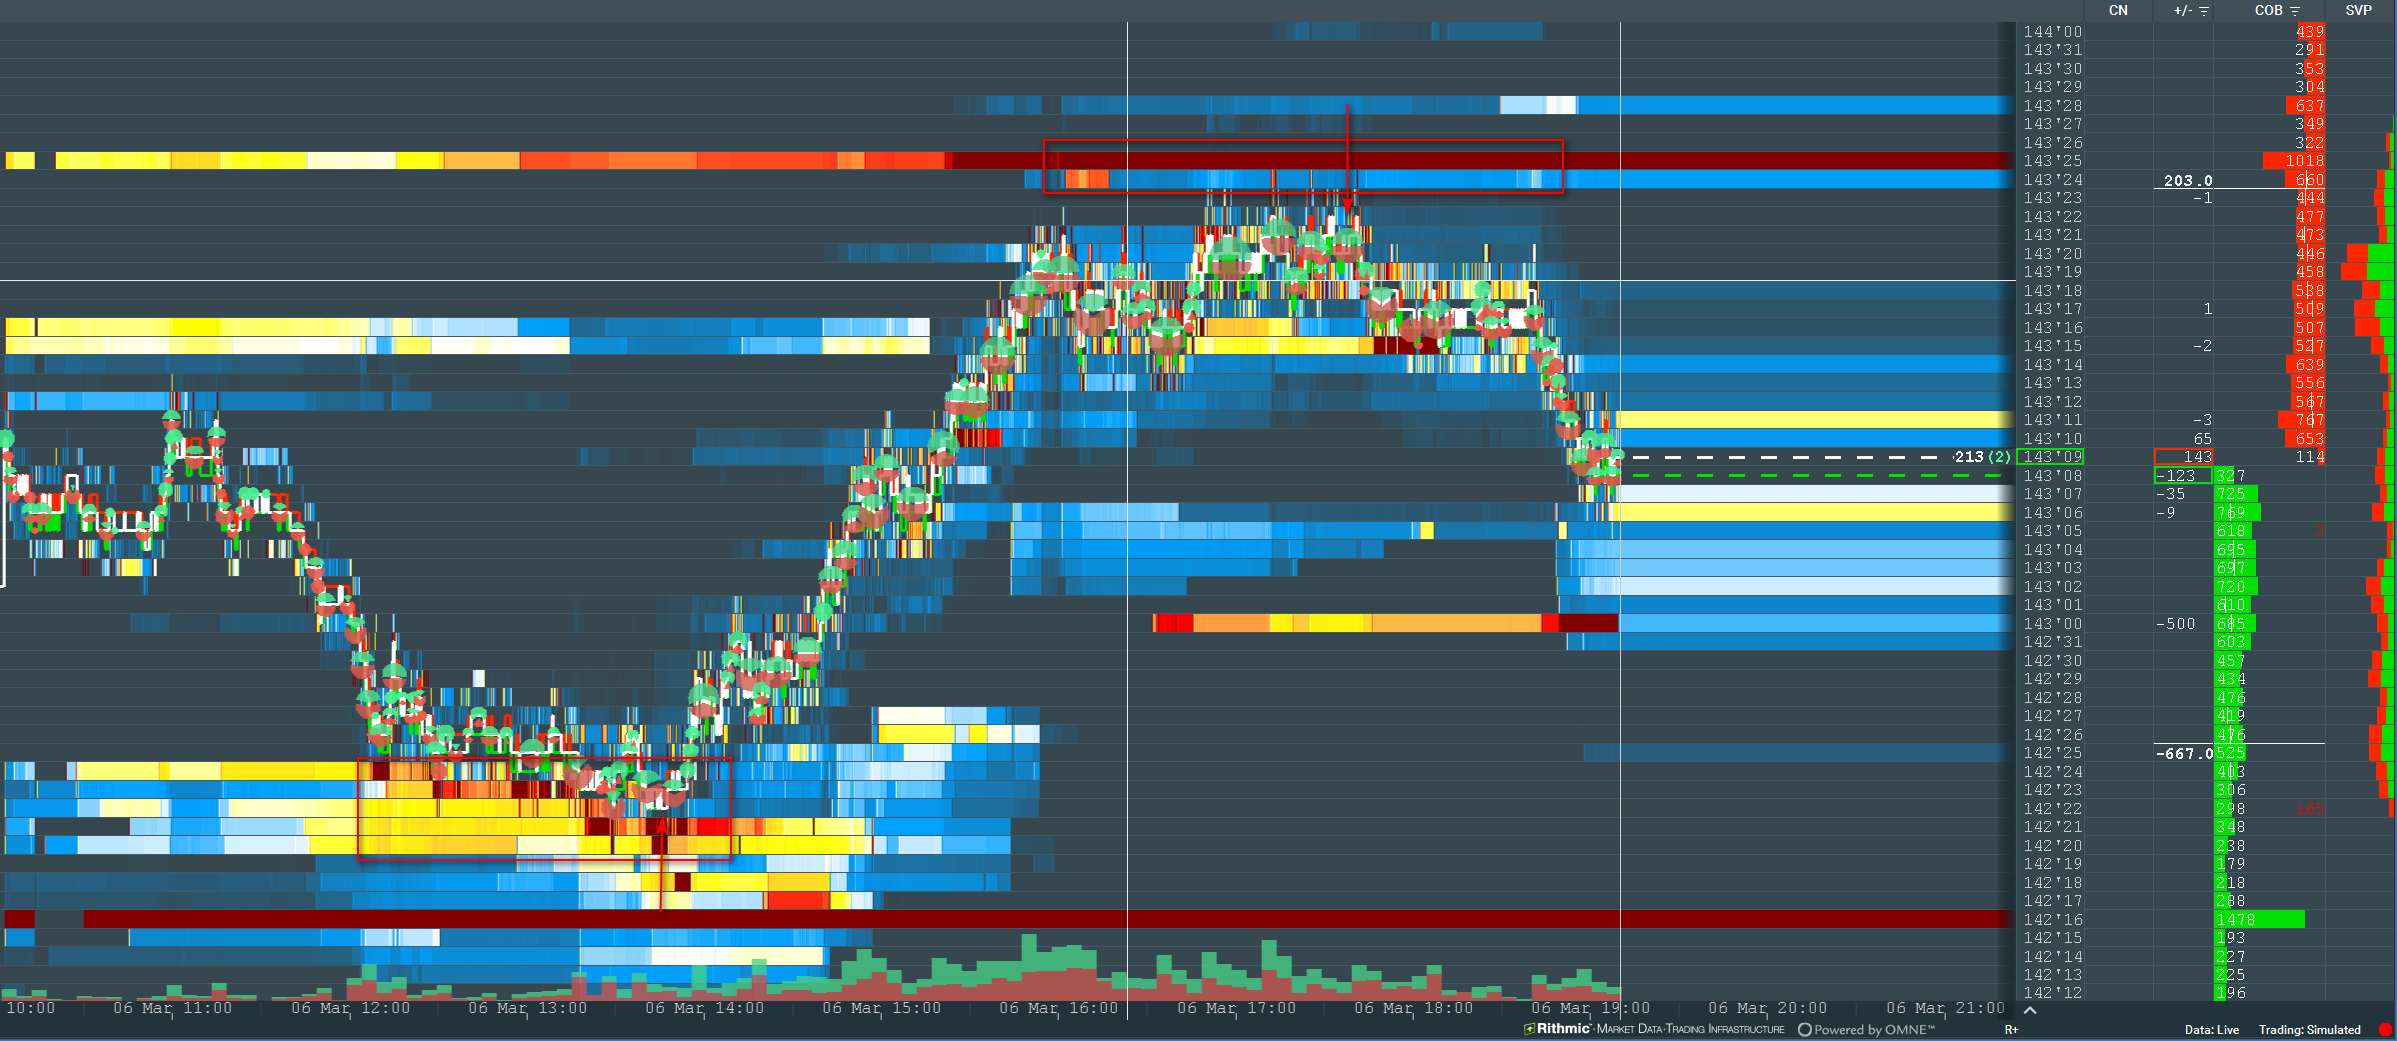
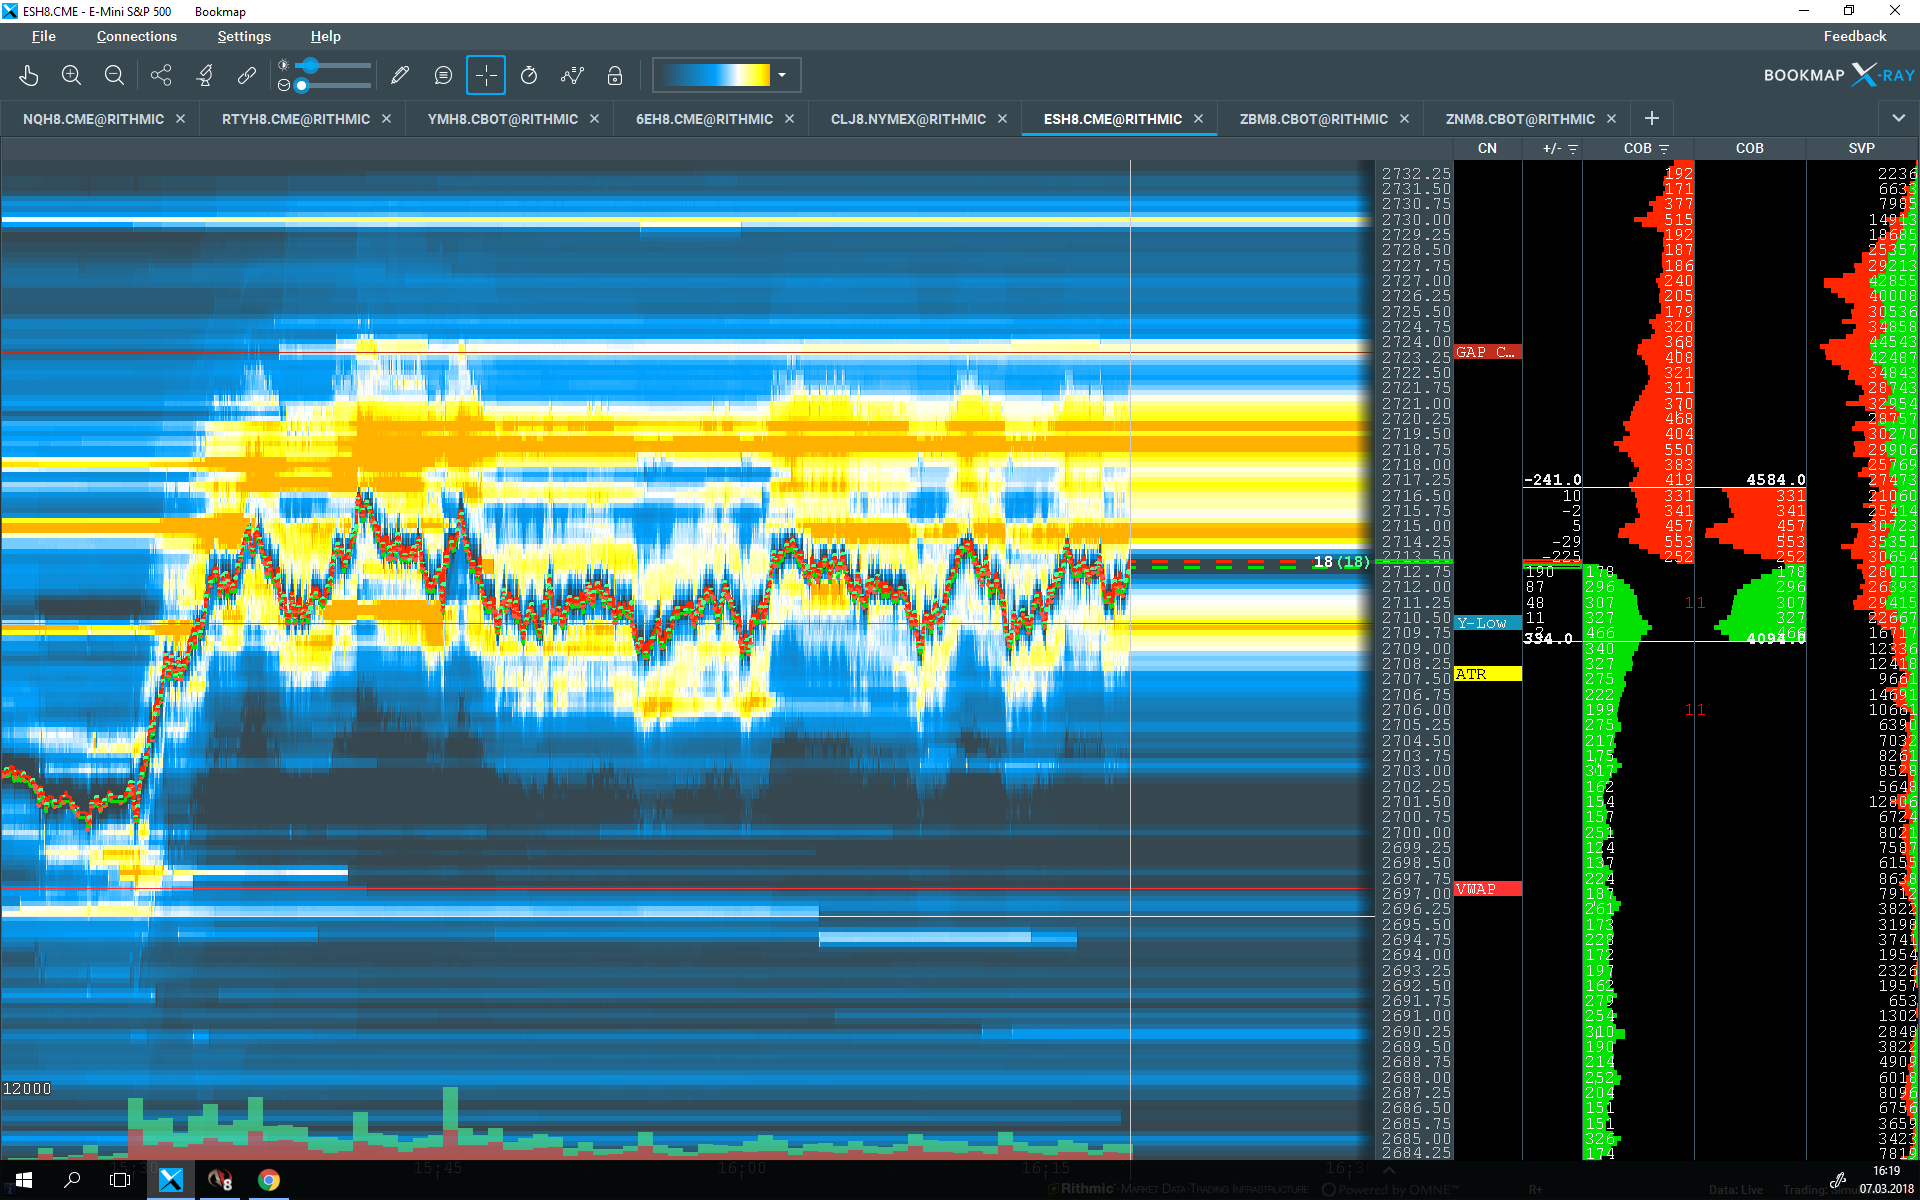
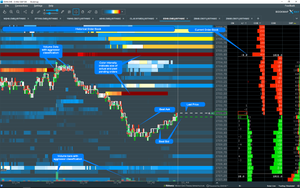
Below I am showing two platforms aimed to different type of traders. It depend on your personal preference which platform you choose: more numerical (Jigsaw daytradr) or more visual (Bookmap™ X-Ray). There are other platforms too but here I am pointing to platforms with integrated visualization capabilities.
Jigsaw daytradr

Bookmap™ x-Ray

Conclusion
To quote Dr. Brett Steenbarger:
"In both cases, the elite traders succeed because they see things that others miss, and that is a function of how they process information, not just their personality traits."
Objectivity tightly relates to the data source you use and the way you present the information. The more you use aggregated data or "manipulated" data, it is harder to keep the objectivity in place.
Simplifying very complex data help our perception making better rational trading decisions. Remember the Kahneman example above: How much is "7x7" or how much is "243 x 873"?
Based on todays trading technologies you can answer 243 x 873 = 212.139 as fast as
7 x 7 = 49.
Watch samples below provided by Bookmap™ X-Ray:

If you have good ideas or thoughts about complexity in trading, leave a comment for a vivid discussion.
Comments