

Improve MAE and MFE with Bookmap™ Heatmap

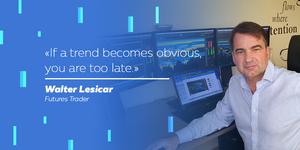
To quote Elon Musk: "If a trend becomes obvious - you are too late." It is true for me and my trading style. I always want to be in the saddle when the ride begins. From the beginning of my trading adventure I went through a tough school of different trading methods and ideologies like: Measured moves, Harmonic Moves like Gartleys, Bats, 1:1, Elliott Waves, Fibonacci Secrets, Gann up to the Murphys Technical Analysis, Charting Techniques, etc.
All of the techniques mentioned above have disadvantages:
They don't take into account the liquidity model of the markets! All of this techniques are highly speculative because a trader is entering a market without knowledge what is really happening and where real markets supports and restistances are.
One of possible measurements of your success as trader are MAE (Maximal Adverse Excursion) and MFE (Maximum Favorable Excursion).
What is MAE and MFE?

MAE marks the lowest price during a long trade and the highest price during a short trade. This helps you to identify what the maximum loss was during a trade. This is also known as maximum drawdown of the position.
MFE marks the highest price during a long trade and the lowest price during a short trade. This shows you what the highest profit was during a trade.
So, if you enter a market too early you will likely have an adverse Risk to Reward Ratio (R/R). Your MAE will be relatively high because of the difference between entry price and lowest market price. If you are lucky, then price turns back and goes in your favour.
If you exit too late MFE will be lower then probably possible. You lost profit.
Can visualization reveal real support and resistance areas?
Yes, it can. Altough, I would speak in terms of order flow of liquidity and accumulation areas.
I highly recommend - before continuuing reading this article - to read Liquidity 1-3 articles in my Posts section.
It's all about liquidity and who is providing liquidity and to which extend - visible or not visible.
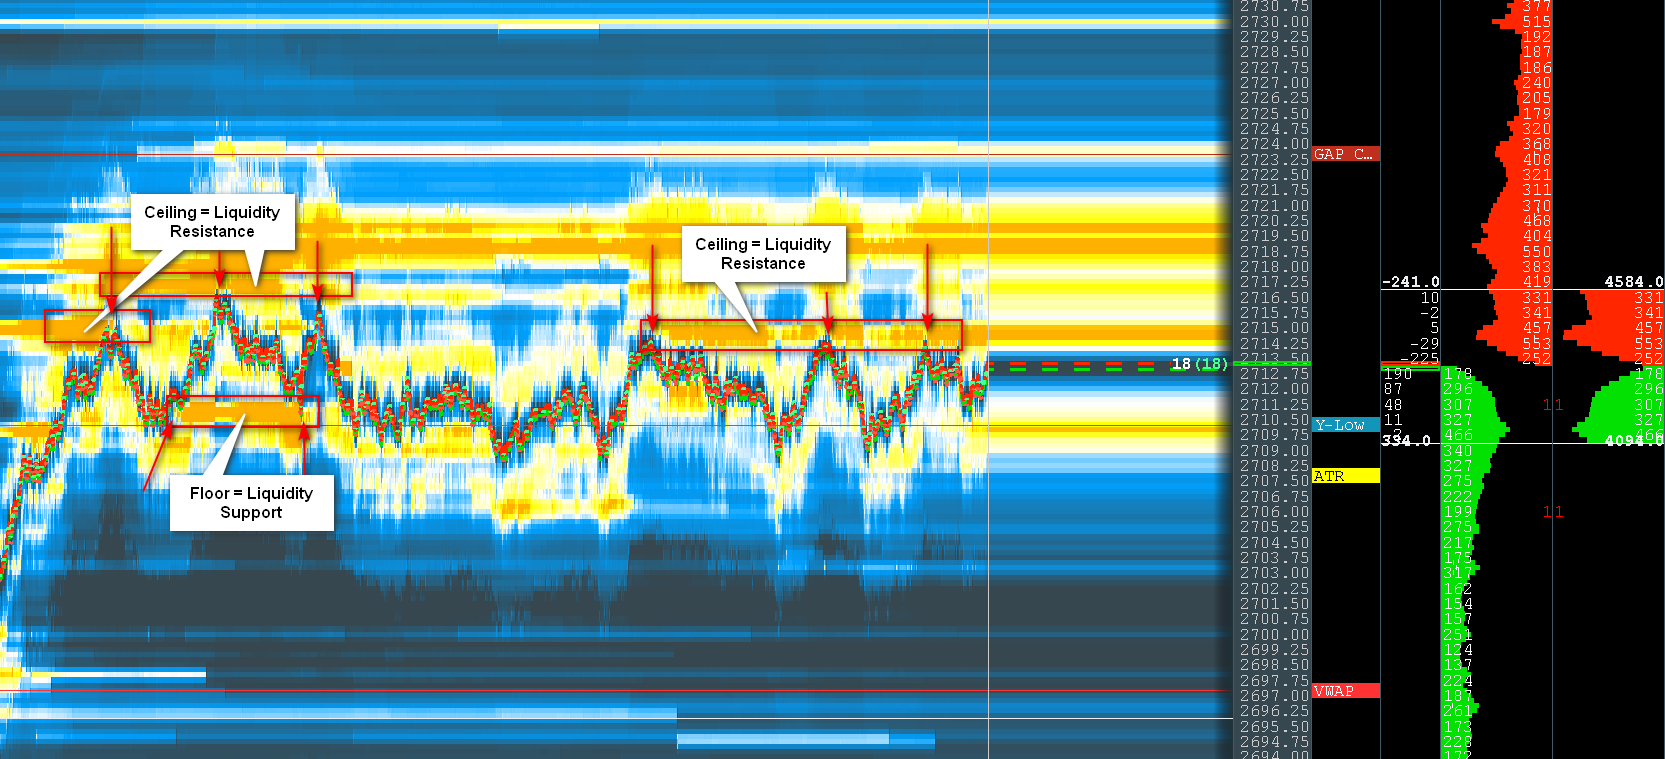
Imagine for a minute that the market is a hi-rise building. Price can rise up when the ceiling is broken and it can move down when the floor is broken. The market does have a ceiling above and a floor below. This is in the form of limit orders and this is what we refer to when we talk of "liquidity". In the market some floors/ceilings are thicker than others and some are thinner than others.
Something needs to "eat" these ceilings for price to move up. The eater of liquidity is called a "market order". When someone submits a market order to the market it eats some liquidity and makes that floor/ceiling a little bit thinner. To trade a market you either need to provide liquidity (limit order) or consume liquidity (market order).
This is what causes price moves. You will often hear people say "price moves up when there are more buyers than sellers". This is impossible. The markets are a mechanism for matching buyers and sellers. If there is no seller, you will not be buying anything. The markets move up because buy market orders consumed seller liquidity at a price level. The next buy market orders will eat the liquidity at a higher price.
Bookmap™ Heatmap
Bookmap takes the market depth numerical data, also known as order book, and visualizes it graphically in a colored heatmap using a predefined colormap selected on the toolbar. This mapping is applied to both the current state of the order book (on the right side of the thin vertical timeline) and on the historical part of the chart on the left. This allows traders to analyze the actions in a market depth of other traders, including the actions of algorithmic traders, HFT, and especially larger players who cause greater impact on the market.
Bookmap™ provides the most objective representation of market data at the current moment and in recent history in an intuitive way. Then it gives the tools to execute trading decisions in a one-click manner on the chart. This lets traders to concentrate their skills on the essential part of the art of trading — interpreting the information and decision making.
The data on heatmap is not an indicator, but the market data itself. Actually, more than 90% of it. A great analogy is described above: Ceilings and Floors. Ceilings are limit order on the offer side and Floors are limit order on the bid side.
Bookmap merely converts the numerical values of market depth data, which is the total size of order book at each price-time coordinate, into a color according to its colormap. Traders can develop an understanding of how markets work and based on this automate or semi-automate their trading strategies.
How does this help in trading?
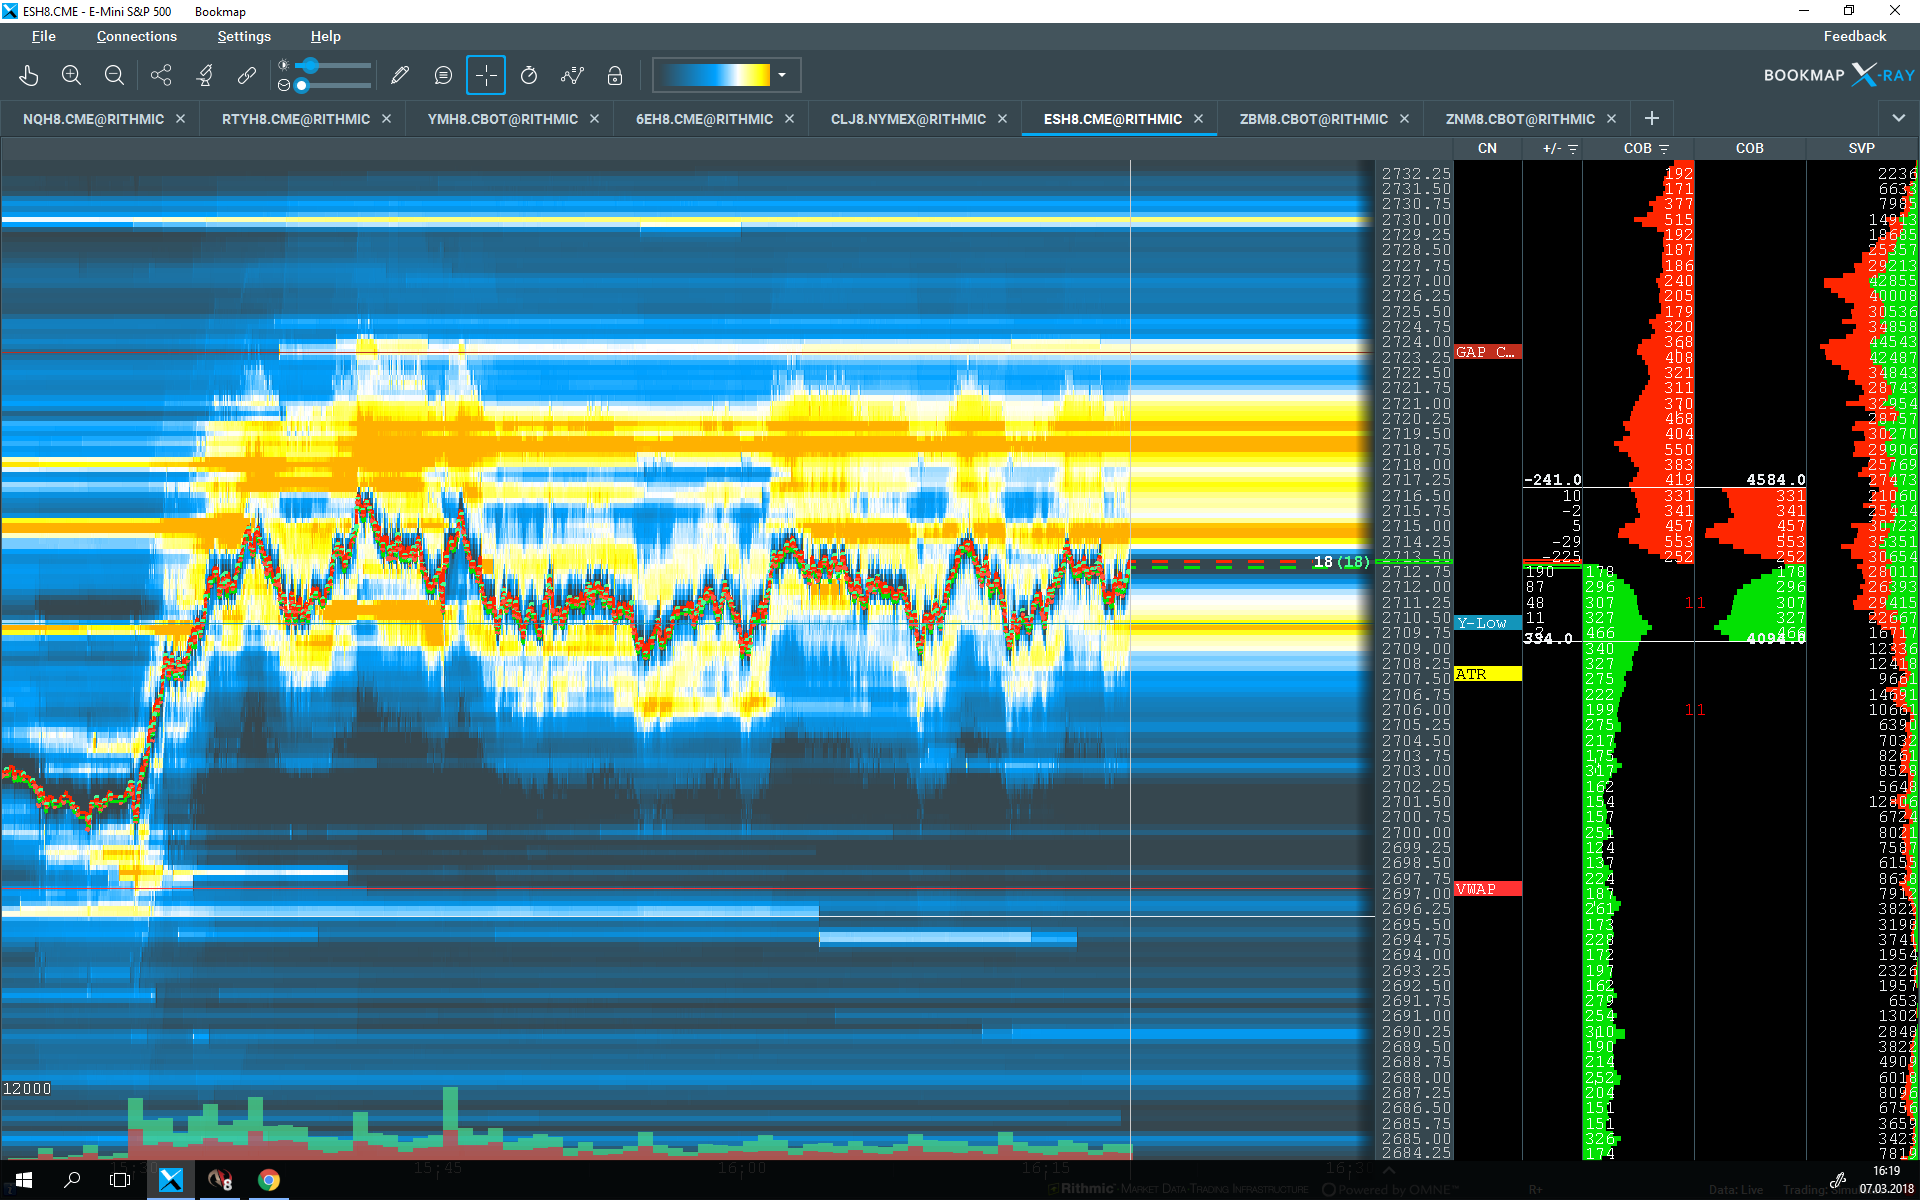
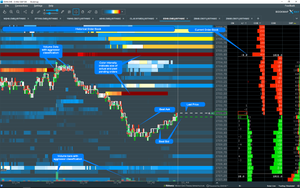
Watch this screenshot:

Isn't it obvious at a glance where liquidity, ceilings and floors, for shown instrument rests? This are real traded data as provided through a serious data provider for subscribed IInd Level Data.
Now you can with confidence and less speculating and hoping:
- Acquire relevant information
- Interpreting the information and decision making
- Execute
How this help you to improve MAE and MFE?
How would you as an experienced trader with sufficient experience intrepreting below shown information:

With an entry or exit at the liquidity levels you can manage your risk better then driving blind through a two-dimensional chart. Liquidity levels are drawn in time by that I mean you are able to see changing limit orders in time and not after a candle or indicator was drawn. You can intrepret and prepare your excecution with confidence and calm.
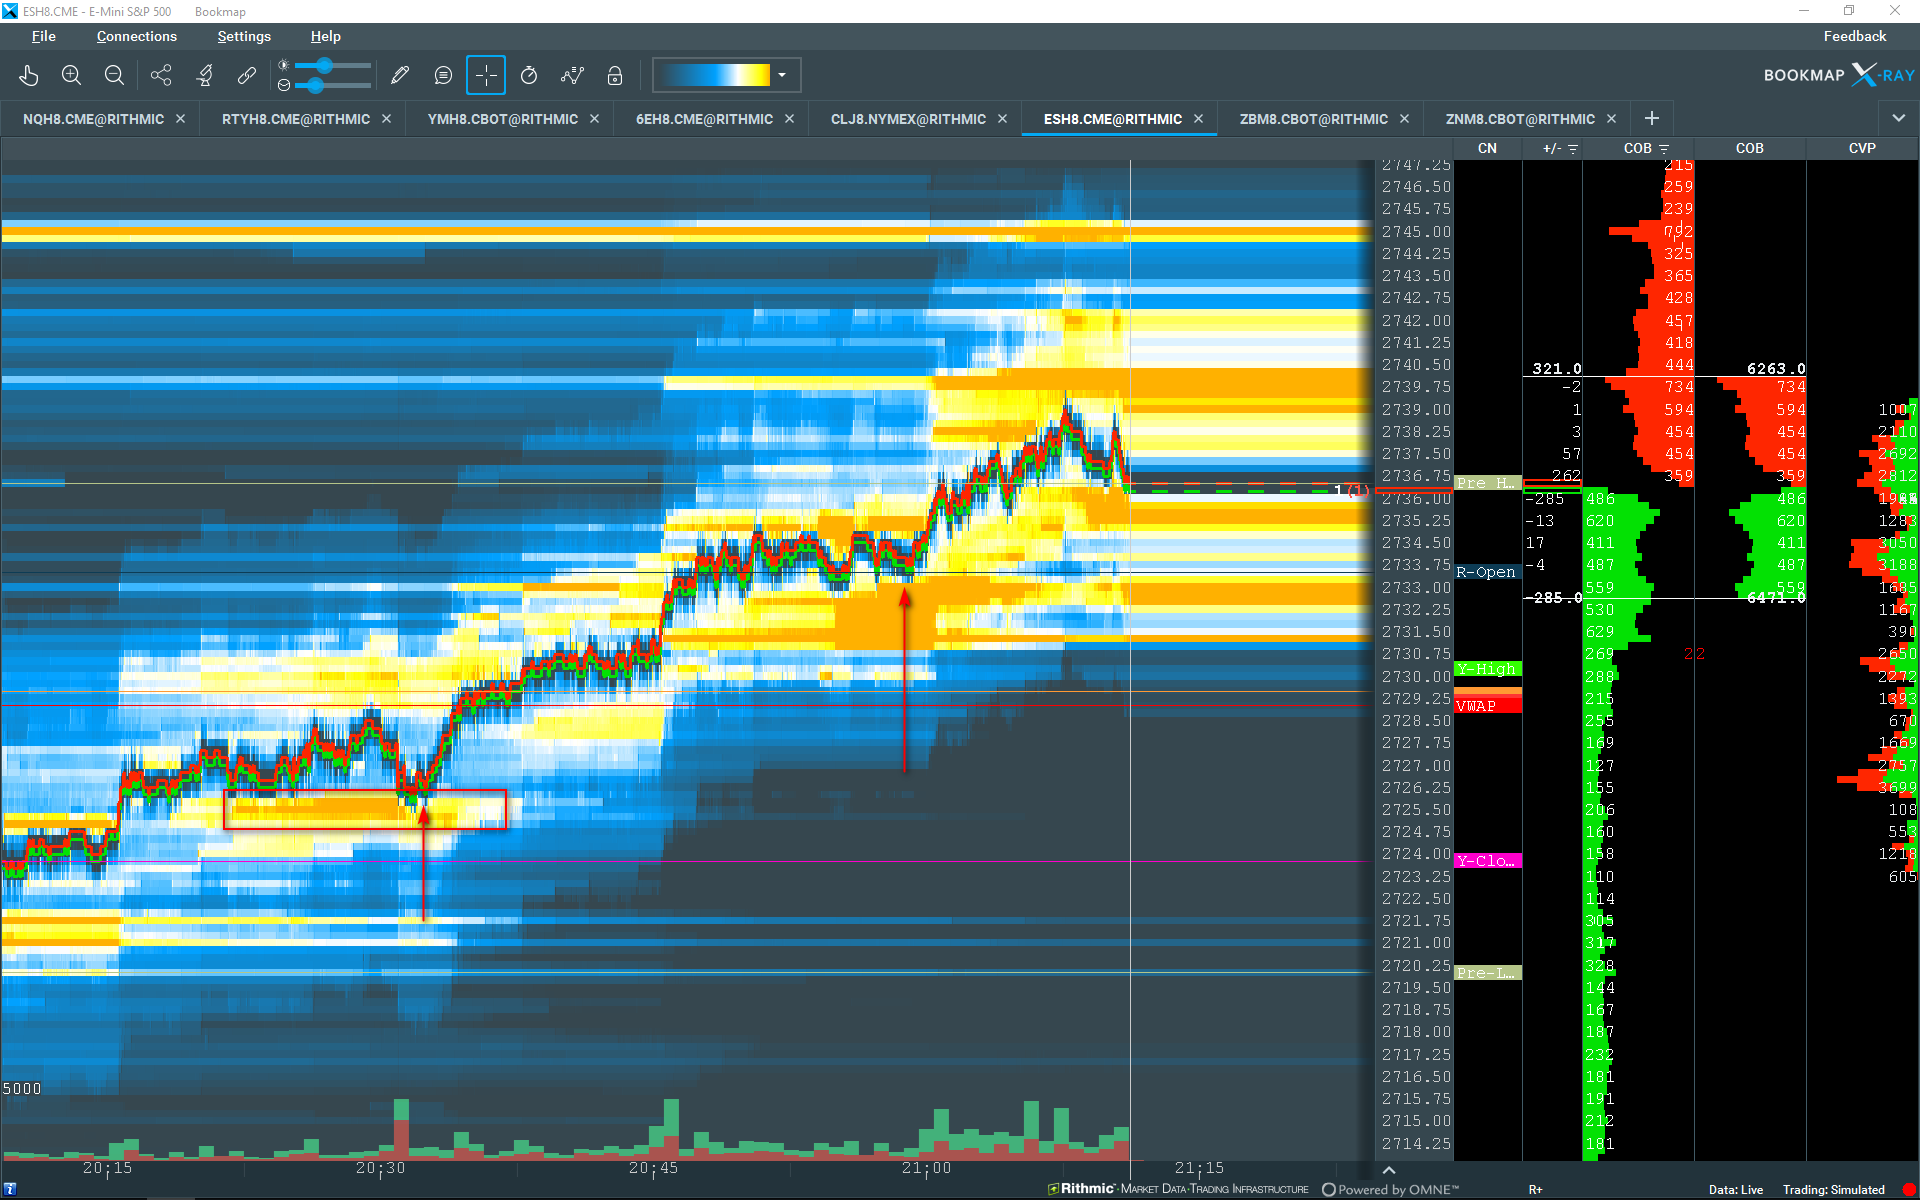
Let's have an example of a micro structure look into the order book:

Long: 2715.50, Stop: 2714.50, Target 2720.00, Exit 2718.50 || MAE: -0.5 / MFE: 3.00
Here's a look at the macro structure of the order book:

Long: 2725.50, Stop: 2724.50, Target: Open until Liquidity shows up around 2734.50, Trailing Stop at 2733.00, || MAE: -0.75 || MFE: 10 pts. theoretically.
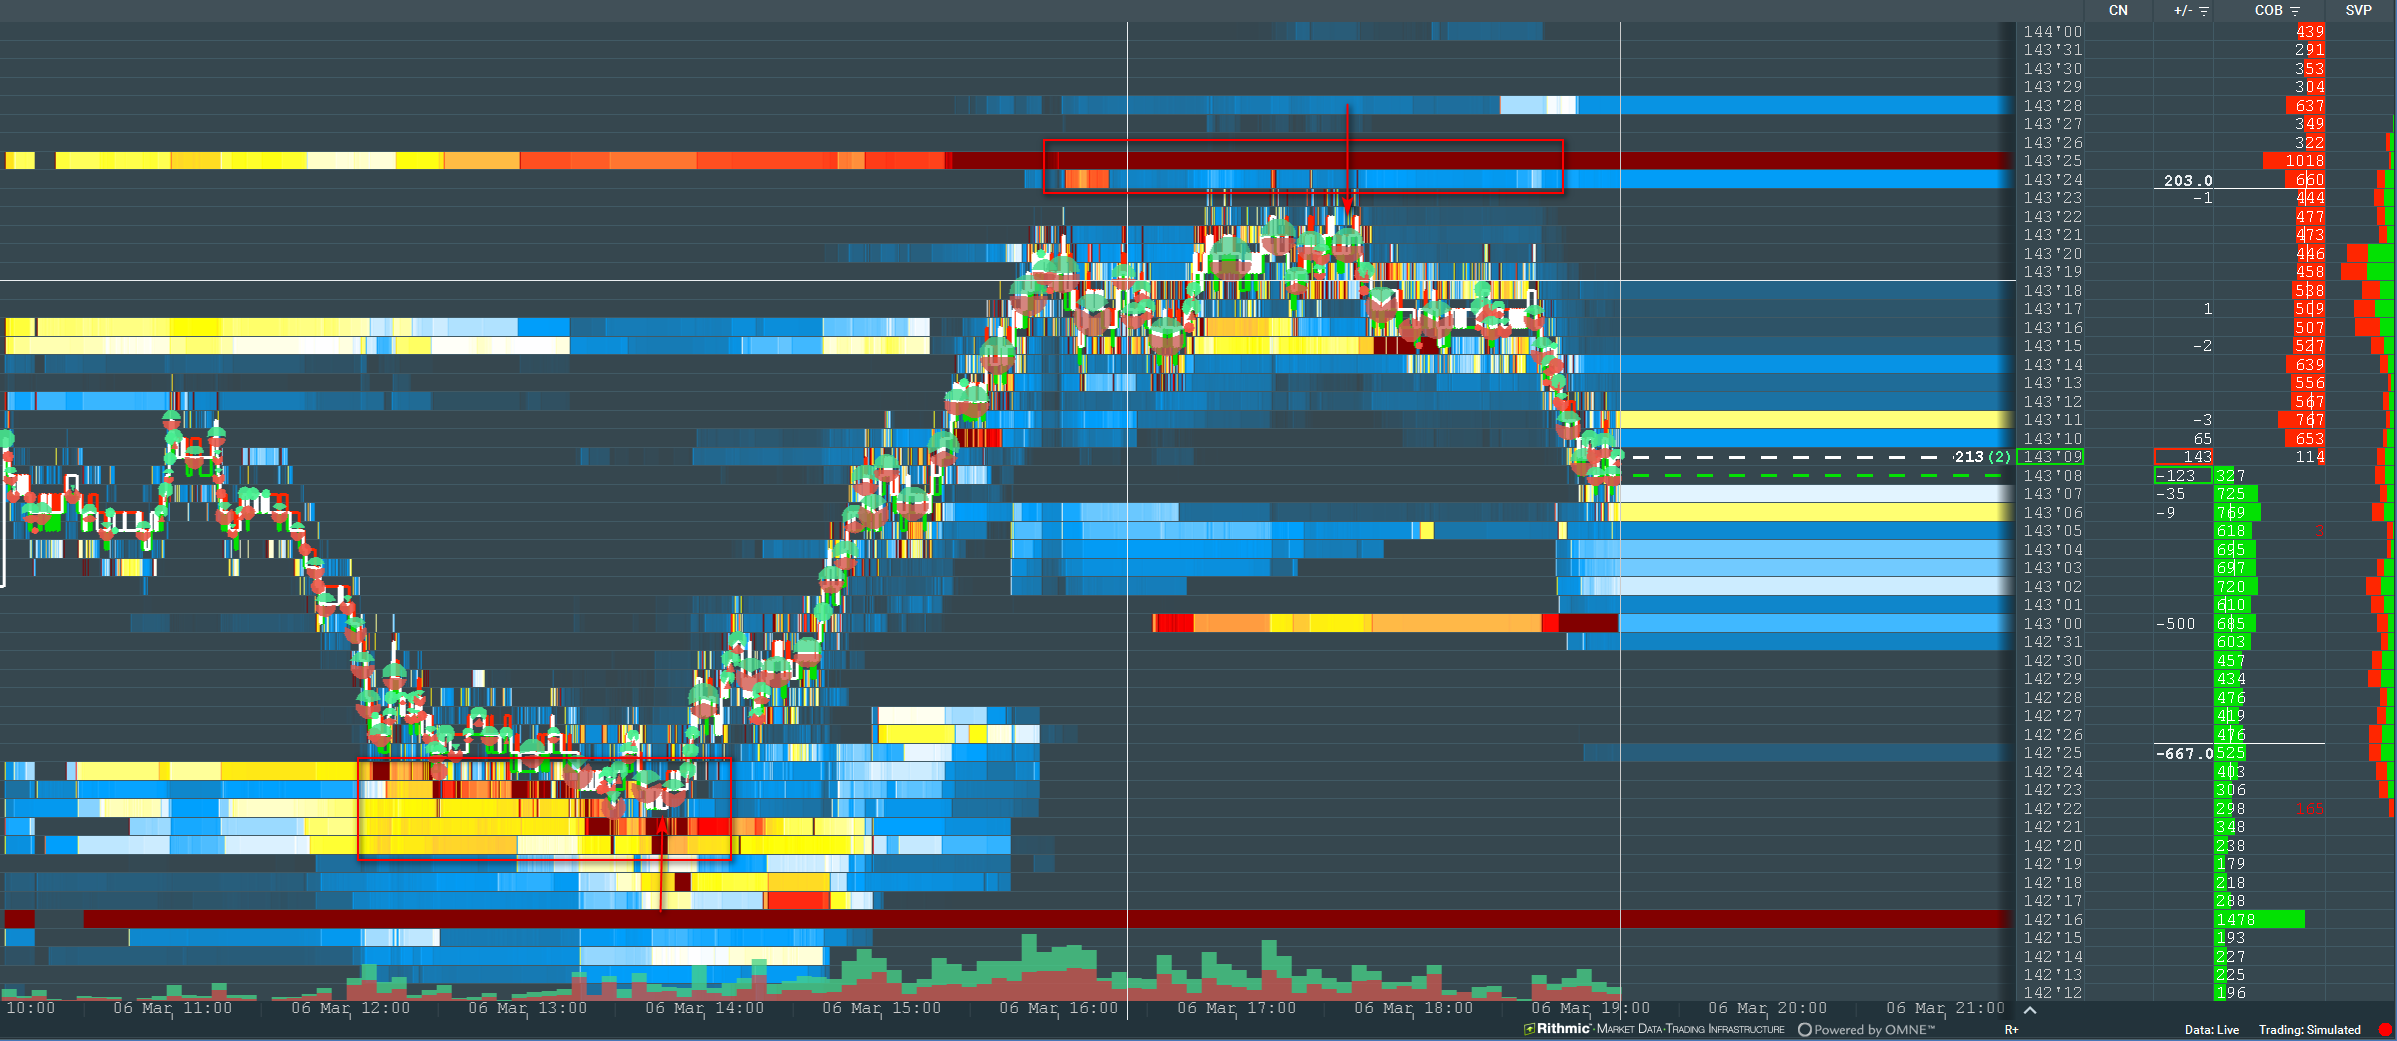
Another good example:

It was evident that 143'25 holds a liquidity on limit offers at about 1018 lots for a long time.
Short: 143'21, Stop: 143'25, Target: 143'17 or trailing stop. || MAE: -0'1 || MFE: 3 - 10 ticks.
Click to enlarge above shown screenshots for more details:

My Conclusion
Is this science? In my opinion it is not. It is all about reading the volume, seeing liquidity filling or missing in the order book. Where are the "Ceilings" and "Floors"? Which side is strong and which is not? Where is the price vacuum?
And at the end: There is always luck involved in trading!
It is just not what you think it is. The luck is not whether you make money or not during your trading career. The luck is how much you make.
Here's some examples from my trading experience:
You see liquidity comes in on the screen, in time. You place the trade. It goes in your favour for, let's say, 10pts in ES. Next day you see the same set up, liquidity shows up, you take the trade but you make only 2 pts in ES. Or in worst case you are being stopped out.
It depends of the day and time if other big market player want to play or not. It doesn't depend on you. However, if you make right trading moves, you'll still make money.
Stay in touch and leave a comment.


Comments